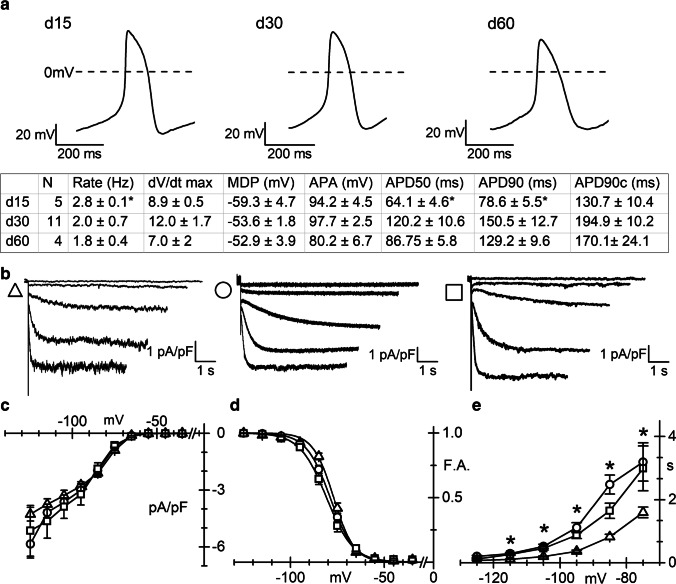
Fig. 1.
Action potential properties and If density and kinetic in pCM. a (Top) Representative spontaneous action potentials recorded from d15, 30, and 60 pCMs, as indicated; (Bottom) Summary table of the AP parameters: APA, action potential amplitude; MDP, maximum disatolic potential; APD, action potential duration at 50% (APD50) or 90% (APD90) of repolarization; APD90c, rate corrected APD90. b Representative traces of the If current density recorded in the range −35/ −115 mV (20 mV increment), at the three different differentiation stages (d15, triangles; d30, circles; d60, squares throughout the figure). c Plot of mean If current density–voltage relations obtained at the different time points. Mean values at −115 mV were as follows: − 3.75 ± 0.29 pA/pF (n = 19), − 4.19 ± 0.45 pA/pF (n = 21), and − 4.64 ± 0.90 pA/pF (n = 13). d Plot of the mean If activation curves; V1/2 and inverse-slope factors were as follows: − 76.5 ± 0.71* mV and 4.8 ± 0.36 (n = 19), − 79.0 ± 0.8 mV and 5.6 ± 0.36 (n = 21), − 81.2 ± 1.37 mV and 6.4 ± 0.47 (n = 13) at days 15, 30, and 60, respectively. Asterisk indicates P = 0.041 day 15 vs 30 and P = 0.0011 day 15 vs 60. e Plots of If activation time constant (τ) in the range − 75 to − 125 mV. Mean τ values at − 75 mV were as follows: 1.6 ± 0.2 s* n = 19; 3.2 ± 0.61 s n = 21; 2.9 ± 0.71 s n = 13, at days 15, 30, and 60, respectively. Asterisk indicates P = 0.0423 day 15 vs 30 and P = 0.0454 day 15 vs and 60

