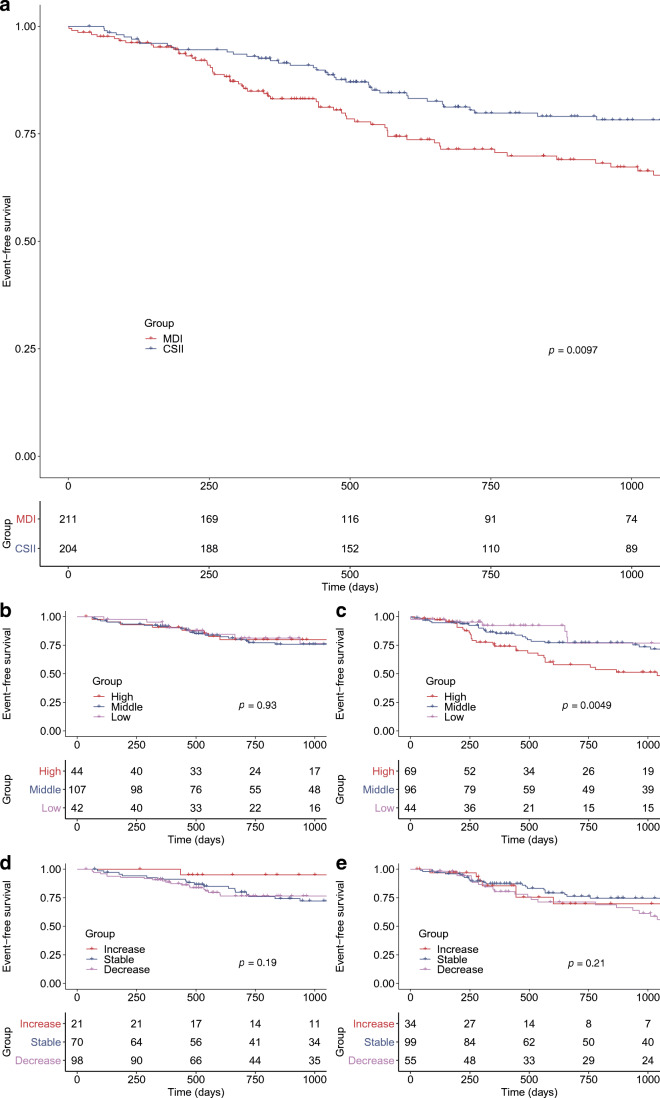
Fig. 2.
Retinopathy in comparator treatment groups (a) and HbA1c subgroups (b–e). Kaplan–Meier survival plots compare event-free survival rates in CSII/MDI treatment groups (a) and HbA1c subgroups (b–e). An event corresponds to diabetic retinopathy progression and was defined as a minimum one-grade worsening in either eye from the baseline grading. Vertical dashes indicate participants who were censored due to incomplete 3 year follow-up. (a) Comparison of CSII (blue) and MDI (red) participants for the entire cohort. CSII was associated with significantly reduced retinopathy progression over 3 years compared with MDI (p=0.0097). (b, c) Comparison of participants with baseline HbA1c <58 mmol/mol (7.5%) (low: lilac), 58–75 mmol/mol (7.5–9%) (middle: blue) or >75 mmol/mol (9%) (high: red) in the CSII group (b) and the MDI group (c). High baseline HbA1c (>75 mmol/mol [9%]) was associated with increased diabetic retinopathy progression in the MDI group (p=0.0049) but was not a determinant of diabetic retinopathy progression in the CSII group (p=0.93). (d, e) Comparison of unmatched participants with change in HbA1c at 1 year of less than −5 mmol/mol (0.5%) (decrease: lilac), −5 to 5 mmol/mol (0.5 to 0.5%) (stable: blue) or more than 5 mmol/mol (0.5%) (increase: red) in the CSII group (d) and the MDI group (e). Change in HbA1c at follow-up did not significantly impact diabetic retinopathy progression in either cohort

