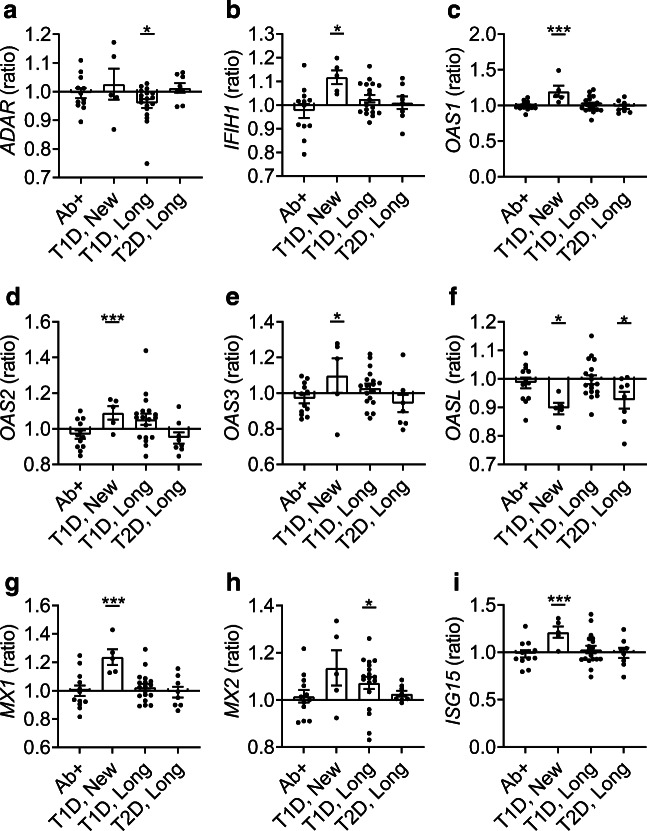
Fig. 4.
Cytokine genes and ISGs that were upregulated by IFN induction. The RNA expression levels of ADAR (a), IFIH1 (b), OAS1 (c), OAS2 (d), OAS3 (e), OASL (f), MX1 (g), MX2 (h) and ISG15 (i) were transformed, and a mean was calculated. The ratio between the mean expression level in each group (autoantibody-positive [Ab+], new-onset type 1 diabetes [T1D, New], longstanding type 1 diabetes [T1D, Long], longstanding type 2 diabetes [T2D, Long]) and the non-diabetic control group was graphed. *p < 0.05 and ***p < 0.001 vs control group

