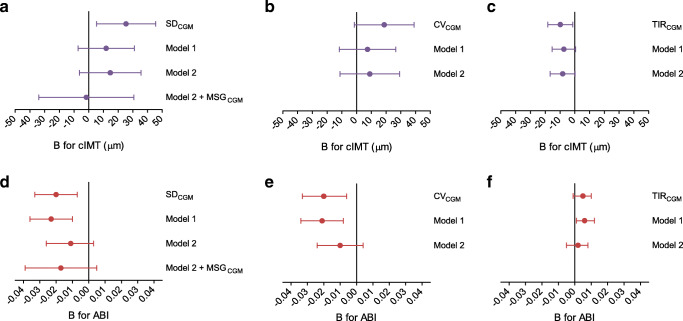
Fig. 2.
Multivariable-adjusted associations of SDCGM, CVCGM and TIRCGM with measures of arterial structure. Regression coefficients (B) indicate the mean difference (95% CI) associated with 1 mmol/l increase in SDCGM or 10% increase in CVCGM or TIRCGM. (a–c) Associations with cIMT and (d–f) associations with ABI. Model 1: adjusted for age, sex and education. Model 2: additionally adjusted for office systolic BP, mean heart rate (in case of ABI only), BMI, smoking status, alcohol use, total-to-HDL-cholesterol levels and use of antihypertensive and lipid-modifying drugs. Model 2 + MSGCGM: additionally adjusted for mean sensor glucose

