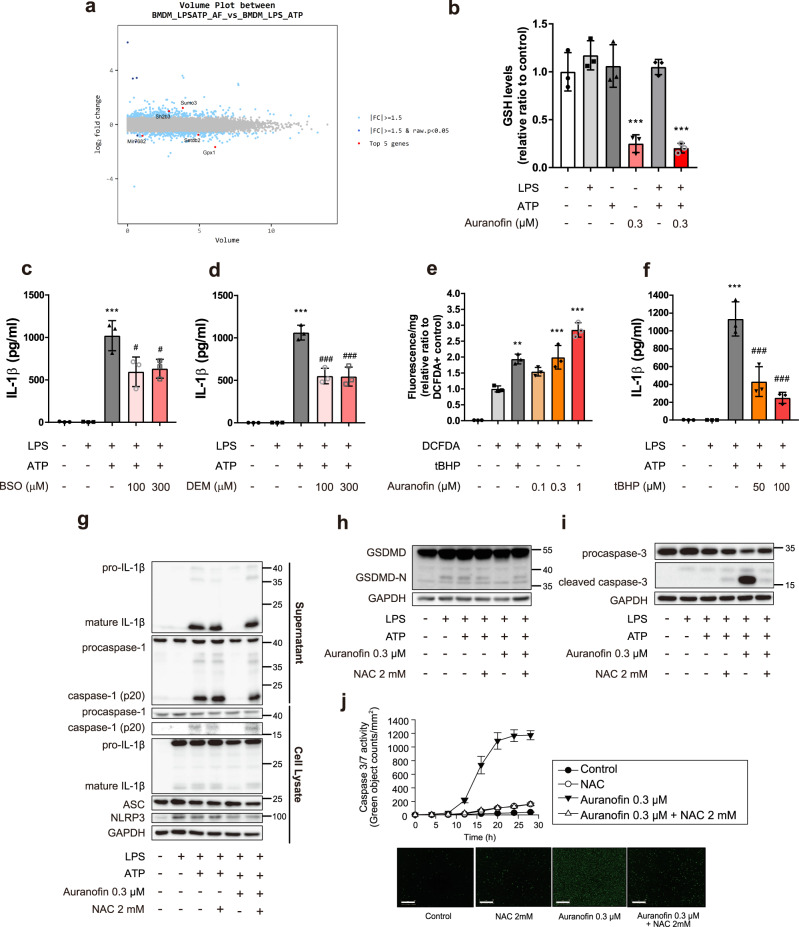
Fig. 5. Inflammasome inhibition effects of auranofin were mediated by ROS bursts.
a Volume plot between LPS/ATP-treated BMDM and LPS/ATP-treated BMDM with 0.3 µM auranofin. b Intracellular GSH levels in BMDM treated with LPS (100 ng/ml), ATP (1 mM) and auranofin (0.3 µM), n = 3; ***p < 0.001 compared to control. c, d Effects of GSH depleting agents on ATP triggered IL-1β release in LPS-primed BMDM. c BMDMs were treated with BSO (100 µM) and LPS (100 ng/ml) for 4 h, followed by exposure to ATP (1 mM) for 1 h, n = 3. d BMDMs were primed with LPS for 4 h, followed by exposure to ATP and DEM (300 µM) for 1 h, n = 3. e Intracellular ROS levels were measured by green fluorescence of DCFDA-positive BMDM, n = 3; **p < 0.01 and ***p < 0.001, compared to DCFDA-positive group. f Effects of tBHP on ATP triggered IL-1β release of LPS-primed BMDM, n = 3; Data are presented as mean ± SD (c, d, and f), analyzed by one-way ANOVA followed by Tuckey’s test. ***p < 0.001 compared to control; #p < 0.05 and ###p < 0.001, compared to NLRP3 inflammasome-induced group. g ATP triggered IL-1β release by NLRP3 inflammasome was determined by western blot analysis in LPS-primed BMDM after cotreatment of NAC with auranofin. h, i BMDMs were primed with LPS (100 ng/ml) for 4 h, followed by exposure to ATP (1 mM), NAC (2 mM) and auranofin for 16 h. GSDMD-N and cleaved caspase-3 were measured using western blot analysis. j BMDM treated with 0.3 µM auranofin and 2 mM NAC. Apoptotic cells were counted using green fluorescence of Incucyte® caspase3/7 reagent. Data are presented as mean ± SEM, n = 4. Scale bar = 300 µm.

