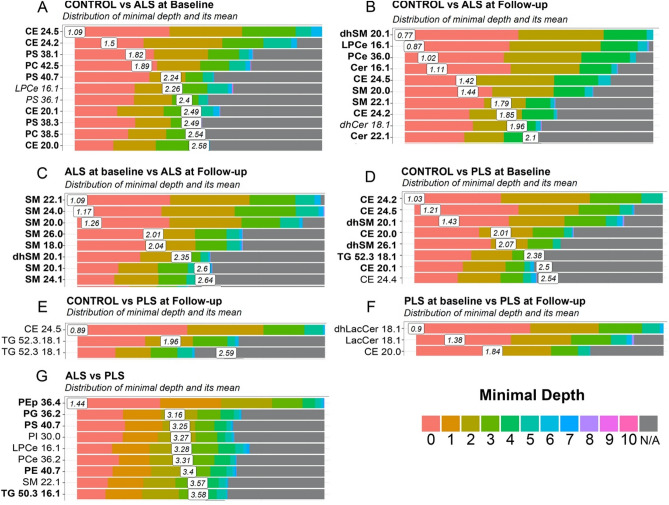
Figure 3.
Random Forest plot representing the distribution of minimal depth and its mean for the indicated groups of samples. (A) Control versus ALS at baseline, (B) Control versus ALS at follow-up, (C) ALS at baseline versus ALS at follow-up, (D) Control versus PLS at baseline, (E) Control versus PLS at follow-up, (F) PLS at baseline PLS at follow-up, (G) Pooled ALS samples versus pooled PLS samples. Species also identified by oPLS-DA are shown in bold.

