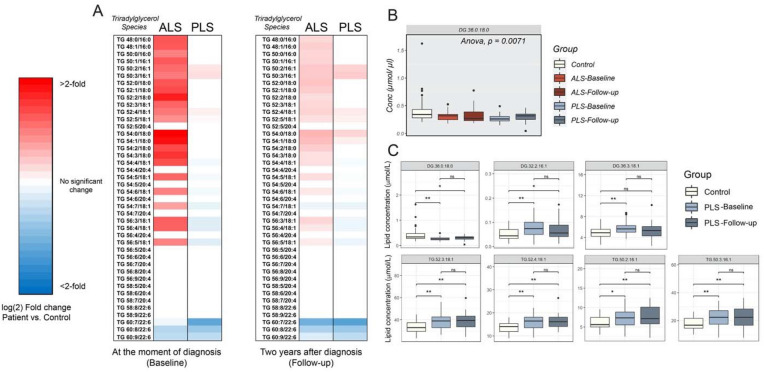
Figure 5.
Analysis of TG in plasma from ALS and PLS patients compared to controls (A) Heat map representation of the most significant fold-changes in the concentration of Triradylglycerols (TG) species in plasma from ALS and PLS patients compared to controls at the beginning of the study (baseline) and 2 years after (Follow-up) (n = 40 ALS , n = 26 PLS samples and 28 controls analyzed in triplicate. *< 0.05; **< 0.01. T-Test). (B) Graph representation of DG species average concentration in ALS and PLS plasma compared to controls. One-way ANOVA. P values are indicated (C) Box plot representations of the most significant fold-changes in the concentration of di- and triglyceride species in plasma from PLS patients compared to controls at the beginning of the study (baseline) and 2 years after (Follow-up) (n = 26 PLS samples and 28 controls analyzed in triplicate. *< 0.05; **< 0.01. T-Test).

