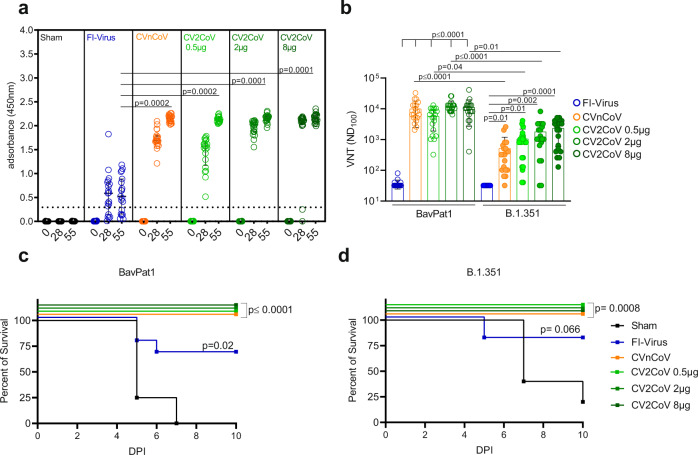
Fig. 1. CVnCoV and CV2CoV protect K18-hACE2 mice against SARS-CoV-2 variants BavPat1 and B1.351.
K18-hACE2 mice that were vaccinated with 8 µg CVnCoV (orange) or different concentrations of CV2CoV (0.5 µg (light green), 2 µg (green), or 8 µg (dark green)), received 106 FI-Virus (blue) or NaCl (black) (sham) on days 0 and 28 followed by i.n. challenge with 105.9 TCID50 of SARS-CoV-2 variant BavPat1 or 105.5 TCID50 B1.351. a RBD ELISA with sera from K18-hACE2 mice on days 0, 28, and 55 of the respective groups: median and interquartile range are presented. Dashed line indicates threshold for positive anti-RBD antibody level. b Virus neutralization assay using day 55 sera from all the groups. Bars indicate mean with SD. c, d Survival curves (Kaplan–Meier) for K18-hACE2 mice from all the groups challenged either with BavPat1 (c) or B.1.351 (d) and followed up for 10 days post infection (DPI). a, b Each dot represents one individual mouse sample. Each sample was tested once (RBD ELISA) or in triplicates (VNT), and assays were repeated at least once. c, d Each line represents groups of mice as shown in a, b from a single experiment (n = 5 sham, n = 10 all other groups). p Values were determined by nonparametric one-way ANOVA and Dunn’s multiple comparisons test (a, b) or two-sided log-rank (Mantel–Cox) test (c, d). Differences were considered significant at p < 0.05 with exact p values displayed in the figure. Source data are provided as a Source data file.

