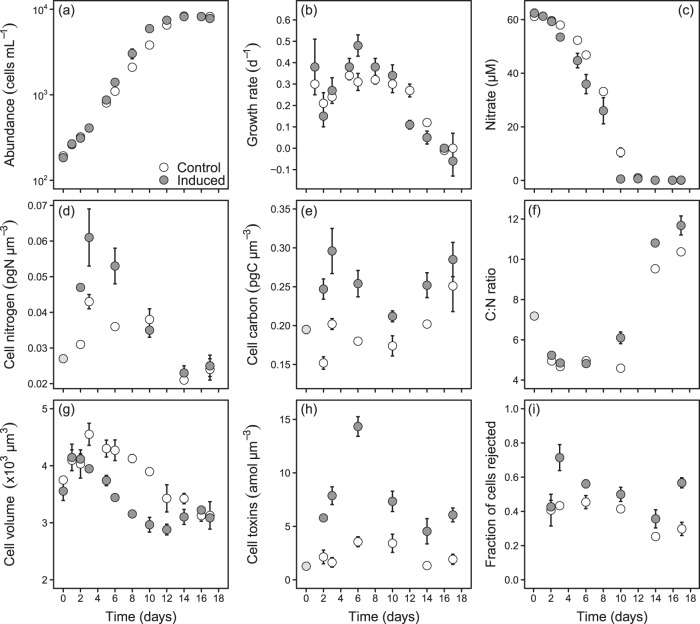
Fig. 1. Changes over time in the batch-culture experiment.
(a) cell abundance (cells mL−1), (b) growth rate (d−1), (c) culture nitrate concentration (µM), (d) cell nitrogen content (pg N µm−3), (e) cell carbon content (pg C µm−3), (f) C:N ratio, (g) cell volume (µm−3), (h) cell toxin content (amol µm−3), and (i) the fraction of cells rejected by copepods. The light-grey points in (d), (e), (f), and (h) are initial values from the stock culture. Values are means and error bars are standard error (n = 3).

