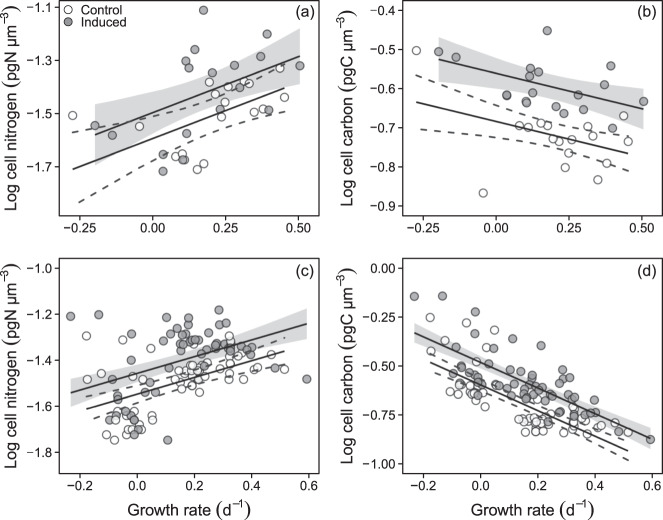
Fig. 2. Relation between cellular nitrogen (N, pg N µm-3) or cellular carbon (C, pg C µm−3), and growth rate (GR, d−1).
(a, b) batch-culture and (c, d) chemostat experiments. Growth rate is calculated from change in biovolume. Multiple linear regression (with 95% confidence intervals) was fit to the data (a) control: log cell N = − 1.594 + 0.420 × GR, induced: log cell N = − 1.497 + 0.420 × GR (R2 = 0.27, p = 0.002); (b) control: log cell C = − 0.684 − 0.181 × GR, induced: −0.561 − 0.181 × GR (R2 = 0.539, p < 0.001); (c) control: log cell N = − 1.546 + 0.363 × GR, induced: −1.456 + 0.363 × GR (R2 = 0.28, p < 0.001); and (d) control: log cell C = − 0.594 – 0.654 × GR, induced: −0.479 – 0.654 × GR (R2 = 0.61, p < 0.001).

