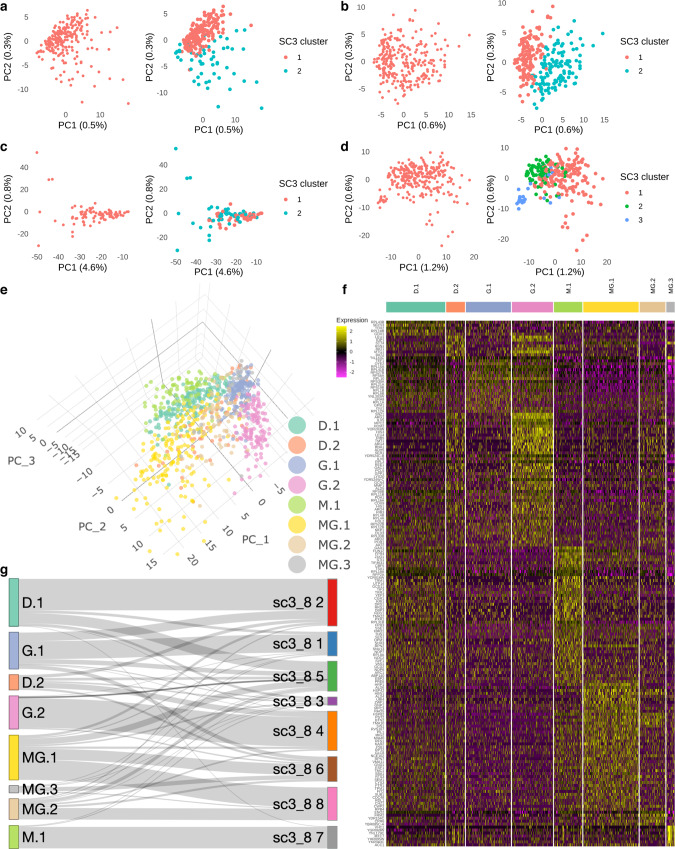
Fig. 3. SC3 consensus clustering reveals the heterogeneity within yeast cells in the 4 samples.
a PCA plot showing the 2 SC3 clusters in DMSO (n = 233 cells). b PCA plot showing the 2 SC3 clusters in Guanine (n = 258 cells). c PCA plot showing the 2 SC3 clusters in MPA (n = 85 cells). d PCA plot showing the 3 SC3 clusters in MPA + Guanine (MG n = 268 cells). e A 3-dimension PCA plot illustrating the distribution of the 8 subclusters (D.1 n = 177, D.2 n = 56, G.1 n = 135, G.2 n = 123, M.1 n = 85, MG.1 n = 166, MG.2 n = 77, MG.3 n = 25 cells) in the 4 samples. f Heatmap illustrating the DE genes corresponding to the 8 subclusters identified by SC3 (Supplementary Data 5). The color represents the normalized expression level in natural-log scale of the corresponding genes of a cell (yellow is high). g Sankey plot illustrating the subclusters identified in separated analysis mapping to the 8 SC3 clusters identified in group analysis. DE genes means differentially expressed genes.

