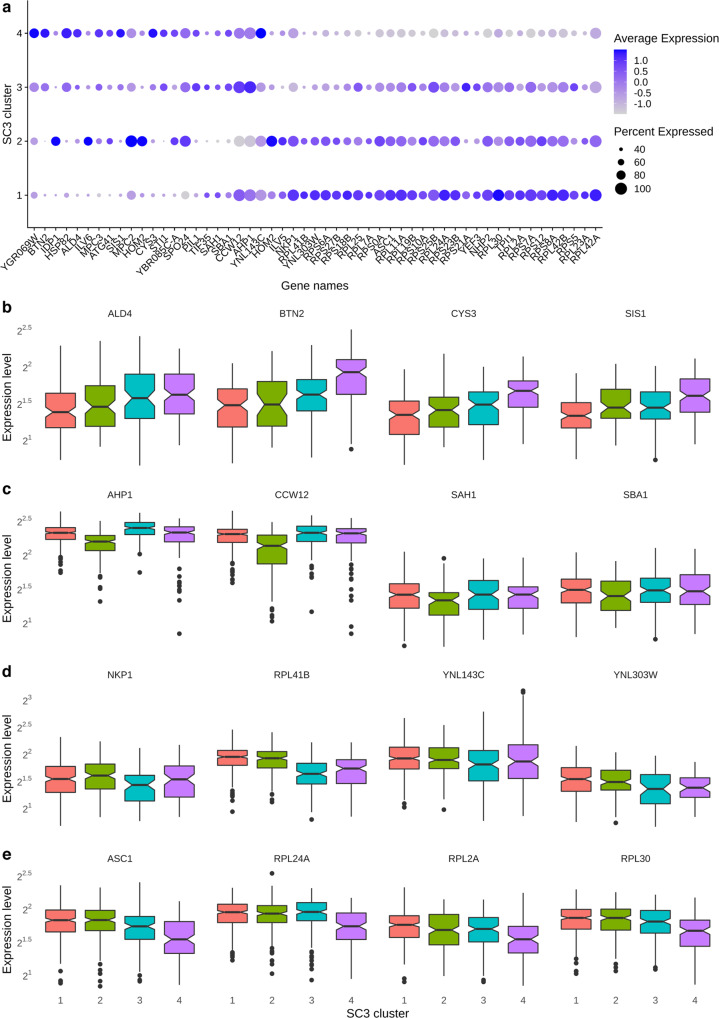
Fig. 5. DE genes in the SC3 clusters with k = 4.
a Dotplot showing the key DE genes (Methods) identified in the 4 SC3 clusters. The size of the dot represents the percentage of cells within a SC3 cluster expressing the corresponding genes, while the color represents the average expression level in natural-log scale of the corresponding genes across all cells within a sample (blue is high). b Boxplot showing the top 4 DE genes in SC3 cluster 1. c Boxplot showing the top 4 DE genes in SC3 cluster 2. d Boxplot showing the top 4 DE genes in SC3 cluster 3. e Boxplot showing the top 4 DE genes in SC3 cluster 4. Boxplots show the median (center line), interquartile range (hinges) and 1.5 times the interquartile range (whiskers); outlier data beyond this range are plotted as individual points. Expression levels are plotted in log 2 scale of normalized UMI (Methods). DE genes means differentially expressed genes. (cluster 1 n = 331, cluster 2 n = 193, cluster 3 n = 164, cluster 4 n = 156 cells).

