Fig. 6.
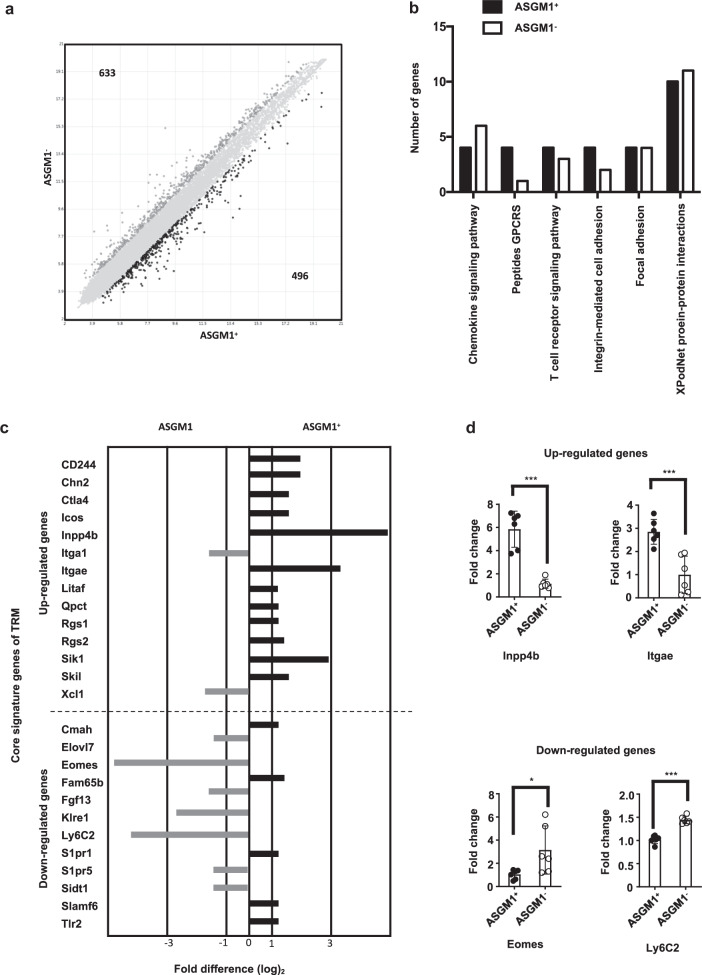
Intrahepatic ASGM1+ CD8 T cells have a distinct transcriptional profile from that of ASGM1− CD8 T cells. a Comparative transcriptome analysis between ASGM1+ and ASGM1− liver CD8 T cells was performed by Affymetrix GeneChip Mouse arrays (Mouse Clariom D). Genes that were expressed greater than or equal to 2-fold higher or lower than in ASGM1− liver CD8 T cells are highlighted in black. The number of genes upregulated or downregulated for each comparison is indicated. b Distribution by functional category of upregulated genes in hepatic ASGM1+ and ASGM1− CD8 T cell subsets. Genes with greater than or equal to 2-fold differences were included. c Fold change expression of tissue-resident memory T cell core signature genes35 in ASGM1+ cells relative to that in ASGM1− CD8 T cells. d Quantitative PCR analysis of representative liver-resident memory T cell core signature genes in intrahepatic ASGM1+ CD8 T cells. *p < 0.05, **p < 0.01, ***p < 0.001 between selected relevant comparisons by Student’s t-test

