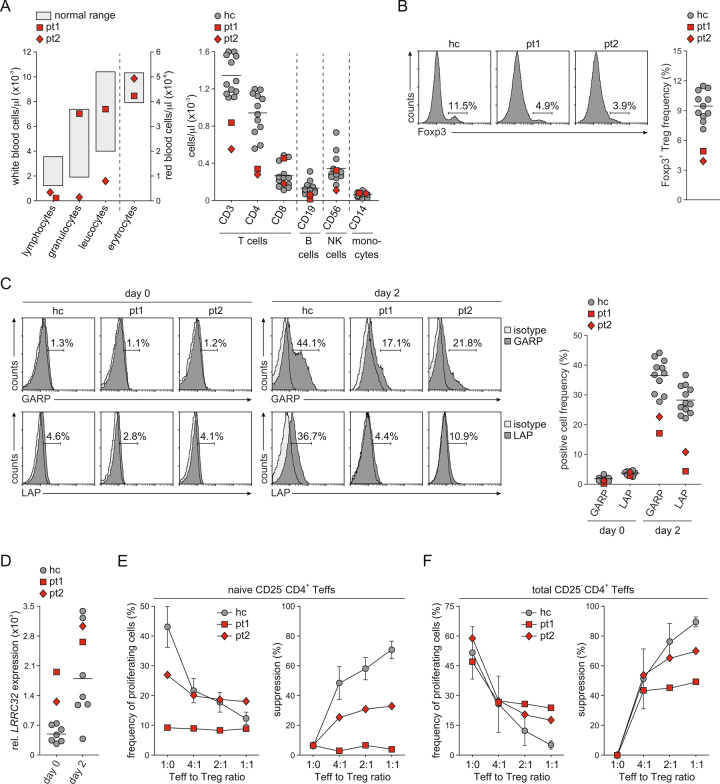
Fig. 2.
Characterization of Tregs from patients with LRRC32 mutations. A Blood cell analysis is depicted. Left panel: White and red blood cell counts in the peripheral blood of patients analyzed by a central laboratory. Normal ranges defined by the central laboratory for clinical tests are included. Right panel: Cell counts of T cells, B cells, natural killer (NK) cells, and monocytes in the peripheral blood were analyzed by flow cytometry. Results from patients are indicated in red. Individual results and the mean value for 12 healthy controls are indicated in gray. B The frequency of Tregs was determined by intracellular flow cytometry for Foxp3 in CD4+ T cells. Representative staining of a healthy control (hc) and staining of both patients are shown. The graph demonstrates the results from the patients in red and the individual results and mean value from 11 healthy controls in gray. C The expression of GARP and LAP on the surface of Tregs was assessed by flow cytometry. Tregs were stained directly after purification (day 0) and after stimulation with anti-CD3 and anti-CD28 antibodies for 2 days. Representative staining histograms of a healthy control and both patients are shown. The graph demonstrates the results from the patients in red and the individual results and mean value from 11 healthy controls in gray. D LRRC32 mRNA expression was assessed in freshly purified Tregs and Tregs stimulated for 2 days by real-time PCR in duplicate. Relative LRRC32 mRNA expression in relation to the mRNA expression of ACTB is shown. The graph demonstrates the results from the patients in red and the individual results and mean value from seven healthy controls in gray. The suppressive effect of Tregs on the proliferation of CFSE-labeled naive (E) and total (F) CD25− CD4+ Teffs in response to anti-CD3 was assessed by flow cytometry at different Teff-to-Treg ratios. The frequency of proliferating Teffs and the calculated suppressive capacity of Tregs are depicted. Gray circles indicate data from healthy controls demonstrated as the mean ± SD of five or eight individuals, respectively

