Fig. 5.
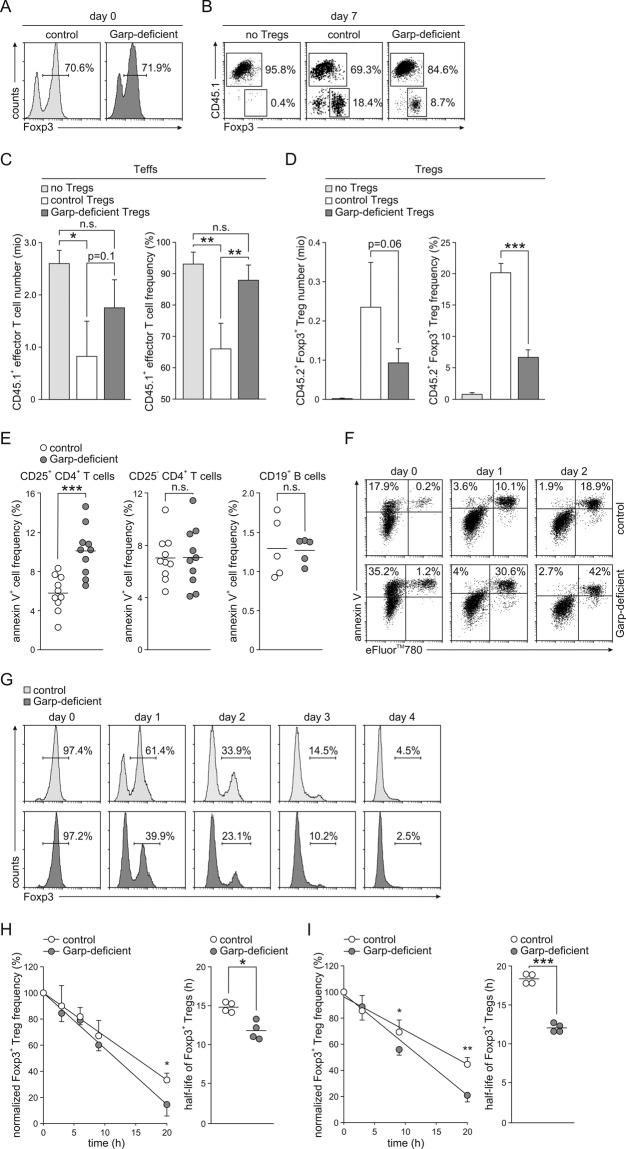
Phenotype of Garp-deficient Tregs. A–D Adoptive transfer of CD45.1+ CD25− Teffs into Rag1-deficient mice alone or together with control or Garp-deficient CD45.2+ Tregs. The data from one representative experiment out of four independent experiments with four to five mice per group are shown. A Representative Foxp3 staining histograms of MACS-purified Tregs before transfection. B Representative staining of recovered CD4+ T cells for CD45.1 and Foxp3. C Numbers and frequencies of CD45.1+ CD4+ T cells in splenocytes harvested 7 days after adoptive transfer. Data are shown as the mean ± SD. D Numbers and frequencies of CD45.2+ Foxp3+ CD4+ T cells in splenocytes harvested 7 days after adoptive transfer. Data are shown as the mean ± SD. E Frequencies of annexin V+ cells in CD25+ CD4+ T cells, CD25− CD4+ T cells, and CD19+ B cells in freshly isolated splenocytes from five to ten mice. Horizontal lines indicate mean values. Apoptosis of FACS-sorted Tregs pooled from five to ten animals and stimulated with anti-CD3 and anti-CD28 antibodies for 2–4 days determined by staining with annexin V and a cell viability dye (F) or an anti-Foxp3 antibody (G) and analysis by flow cytometry. One representative experiment out of two independent experiments is shown. H, I Analysis of Treg stability. Frequency of Foxp3+ Tregs within CD4+ T cells cultured without stimulation (H) or stimulated with anti-CD3 and anti-CD28 antibodies for 20 h (I) in the presence of CHX assessed by intracellular flow cytometry. The results of four independent experiments are summarized and shown as the mean ± SD for Treg frequency and as the results of individual experiments with the calculated mean value indicated by the line for the Treg half-life. Linear regression calculated on normalized frequencies of Foxp3+ Tregs is shown on the left, and the half-life of Foxp3+ Tregs calculated based on linear regression is shown on the right

