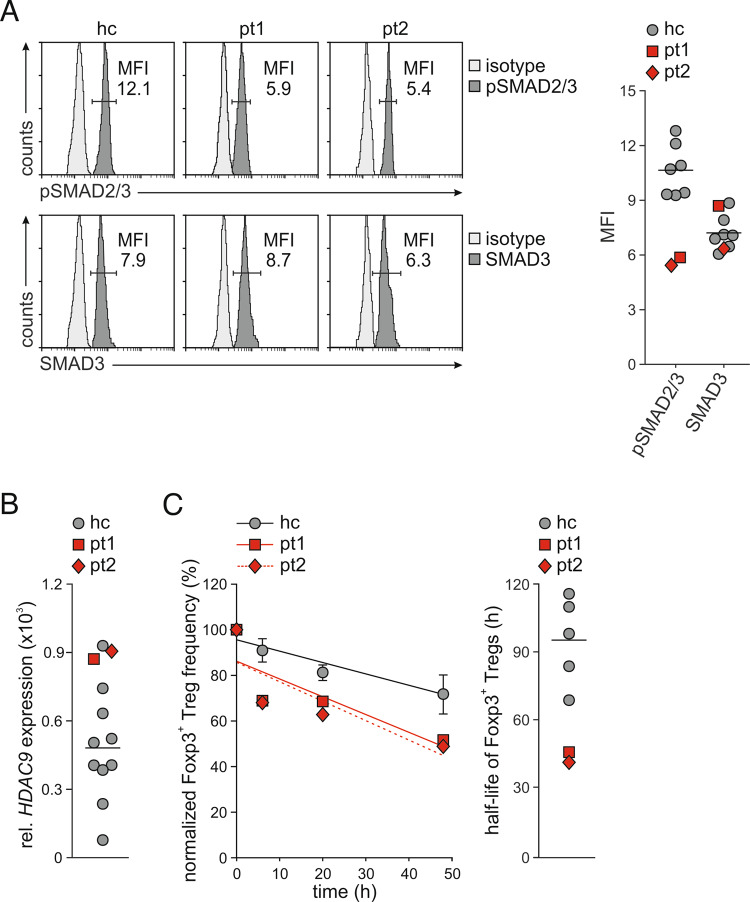
Fig. 8.
Analysis of SMAD2/3 phosphorylation, HDAC9 expression, and Treg stability in human Tregs with LRRC32 mutations. A Basal SMAD2/3 phosphorylation and expression in freshly isolated Tregs were determined by intracellular flow cytometry. Representative staining histograms of a healthy control (hc) and both patients are shown. The graph demonstrates the results from the patients in red and the individual results and mean value from seven healthy controls in gray. MFI mean fluorescence intensity. B HDAC9 mRNA expression was assessed in freshly purified Tregs by real-time PCR in duplicate. Relative mRNA expression in relation to the mRNA expression of ACTB is shown. The results from the patients are shown in red and those from ten healthy individuals are shown in gray. The horizontal line indicates the mean value of healthy controls. C Analysis of Treg stability. The frequency of Foxp3+ Tregs within CD4+ T cells was assessed in the presence of CHX by intracellular flow cytometry. In the analysis of Treg frequency, gray circles indicate mean values demonstrated as the mean ± SD of five individuals. In the analysis of the Foxp3 half-life, gray circles indicate the individual results of healthy controls, and the horizontal line indicates the mean value of healthy controls. Linear regression calculated based on normalized frequencies of Foxp3+ Tregs cells is shown on the left, and the half-life of Foxp3+ Tregs calculated based on linear regression is shown on the right

