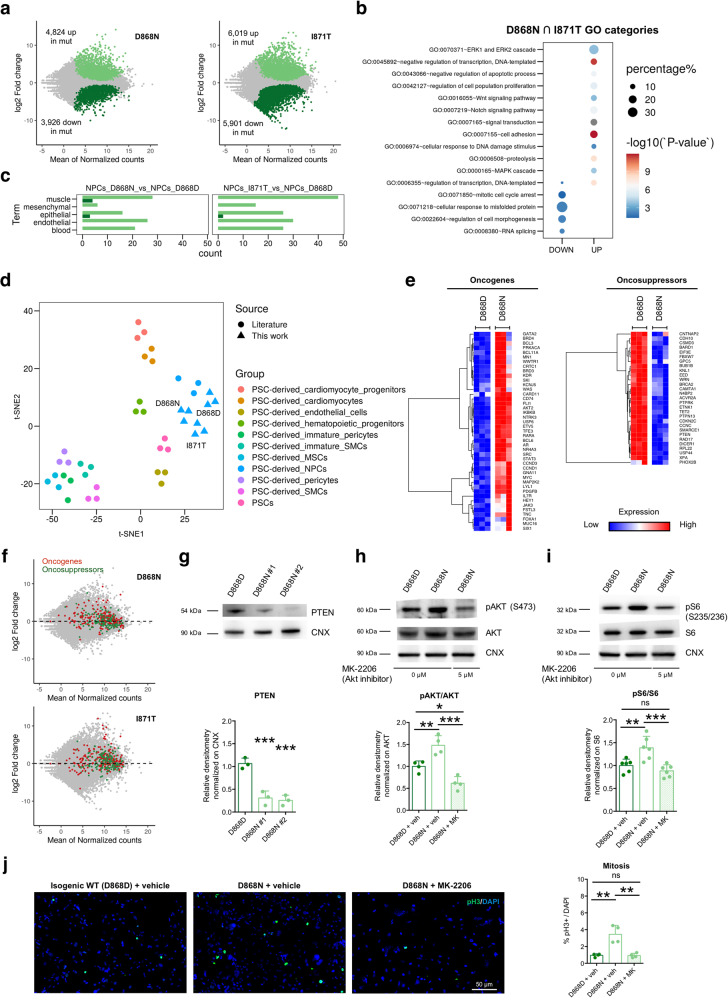
Fig. 4. SGS mutations lead to profound gene dysregulation and oncogenic signature.
a MA plot showing log2-fold changes as a function of average gene expression for isogenic pairs of NPCs. Differentially expressed genes highlighted with their respective color codes. b Enrichment plot displaying relative enrichment (%; size) and statistical significance (−log10 P value; color scale) of gene ontology categories of interest in SGS lines. c Histograms showing the number of GO categories relative to the indicated different lineages, calculated in the list of genes upregulated in controls (dark green) and mutant NPCs (light green) as in RNA-seq dataset. d Whole transcriptome dimensionality reduction by t-SNE highlighting the similarities between D868D, I871T, and D868N NPCs in comparison with other pluripotent stem cell derivatives (data from literature), including NPCs. e Gene expression heatmaps of upregulated oncogenes and downregulated oncosuppressors in D868N vs. D868D NPCs. f COSMIC Oncogenes (red) and oncosuppressor genes (green) among the transcriptomic profiles of the two mutations, shown as highlighted dots in the MA plots. g PTEN immunoblotting in isogenic control and mutant NPCs (#1 and #2: independent clones): D868D vs. D868N #1 ***P = 0.0010, D868D vs. D868N #2 ***P = 0.0007, n = 3. h Total and phosphorylated AKT (pAKT Ser473) immunoblotting in isogenic control (+vehicle) and mutant NPCs (+vehicle or MK-2206 AKT inhibitor) and quantification as pAKT/AKT ratio. D868D + veh vs. D868N + veh **P = 0.0079, D868D + veh vs. D868N + MK *P = 0.0261, D868N + veh vs. D868N + MK ***P = 0.0001, n = 4. i Total and phosphorylated S6 (pS6 Ser235 and pS6 Ser236) immunoblotting in isogenic control (+vehicle) and mutant NPCs (+vehicle or MK-2206) and quantification as pS6/S6 ratio. D868D + veh vs. D868N + veh **P = 0.0063, D868D + veh vs. D868N + MK P = 0.5338, D868N + veh vs. D868N + MK ***P = 0.0007. n = 6. j NPC proliferation assay by phosphorylated H3 (pH3 Ser10) immunostaining in isogenic control (+vehicle) and mutant NPCs (+vehicle or MK-2206). D868D + veh vs. D868N + veh ***P = 0.0009, D868D + veh vs. D868N + MK P = 0.9990, D868N + veh vs. D868N + MK ***P = 0.0009. n = 4. Data expressed as mean ± SEM. ∗P < 0.05, ∗∗P < 0.01; ***P < 0.001, ****P < 0.0001. Images taken at the same magnification. g–j Data are analyzed by one-way ANOVA followed by Tukey’s post hoc test for multiple comparisons.

