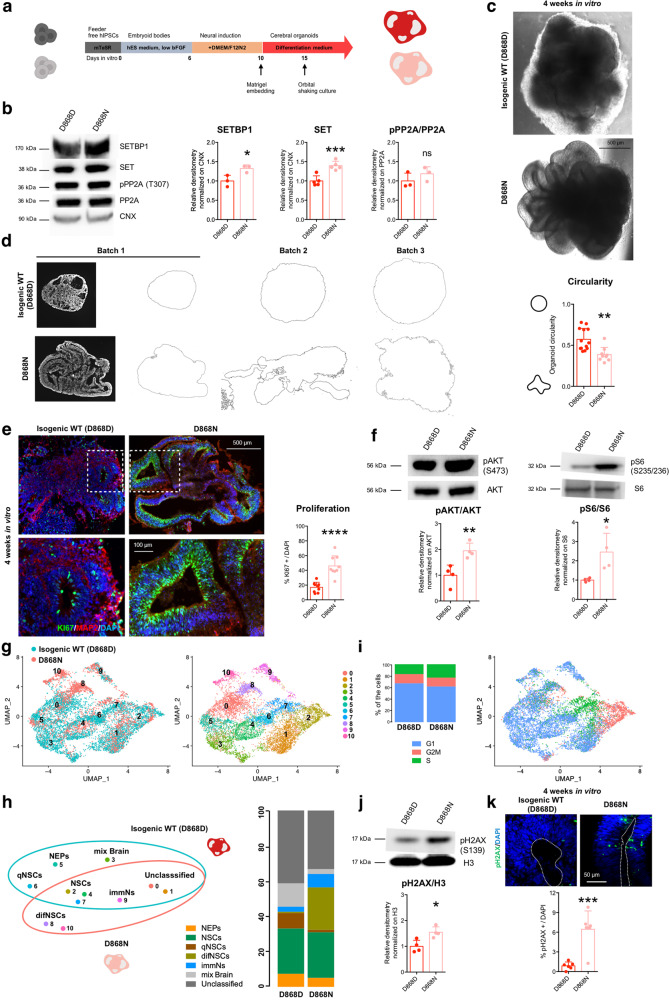
Fig. 6. Mutant organoids recapitulate SGS-associated features.
a Scheme for cerebral organoid generation protocol. b SETBP1-SET-PP2A axis in cerebral organoids: immunoblotting for SETBP1 (*P = 0.0329, n = 3), SET (***P = 0.0009, n = 5) and pPP2A/PP2A ratio (P = 0.3084, n = 3) in isogenic control (D868D) and mutant (D868N) organoids. c Representative bright-field images (taken at the same magnification) of D868D and D868N organoids. d Evaluation of gross morphological appearance of control and mutant organoids. Images (taken at the same magnification) of serial histological sections from 4-week-old organoids from three independent batches were converted into outlines for the quantification of the perimeter and circularity. **P = 0.0015. b = 3 (batches), o ≥ 9 (organoids). e KI67and MAP2 immunostaining of cryo-sections of D868D and D868N organoids. Insets indicate the magnifications below (left). Quantification of KI67 + /DAPI cells in representative ventricular-like structures (right, ****P < 0.0001). b = 3 (batches), o = 3 (organoids), v = 9 (ventricles). Images taken at the same magnification. f Left, total and phosphorylated AKT (pAKT Ser473) immunoblotting and quantification of pAKT/AKT ratio in D868D and D868N organoids. (**P = 0.0085). Right, total and phosphorylated S6 (pS6 pS6 Ser235, pS6 Ser236) immunoblotting and quantification of pS6/S6 ratio in D868D and D868N organoids. (*P = 0.0253,). n = 4. g Left, UMAP plot showing the distribution of cells from 4-week-old organoids of SGS genotype (D868N, salmon) and isogenic control (D868D, light blue). Right, UMAP plot of cells from 4-week-old organoids of D868N and D868D showing 10 clusters (resolution 0.7). h Left, cluster categorization (NEPs = neuroepithelial cells; NSCs = neural stem cells; qNSCs = quiescent NSCs; difNSCs = differentiating NSCs; immNs = immature neurons; mix Brain = cells of several stages from different cell regions) and diffusion among genotypes. Right, bar plots of the enrichment of the different cluster categories within the two genotypes. i Left, cell cycle distribution in 4-week-old organoids of D868N and D868D. Right, UMAP plot of cells from 4-week-old organoids of D868N D868D showing cell cycle distribution. j pH2AX (Ser139) immunoblotting and quantification in D868D and D868N organoids. (**P = 00019n = 4). k Phosphorylated histone H2AX (pH2AX Ser139, immunostaining in rosettes of isogenic control and mutant 4-week-old organoids (***P = 0.0008). A dashed line indicates ventricular surface. b = 3 (batches), o = 3 (organoids), v = 6 (ventricles). Images taken at the same magnification. All data expressed as mean ± SEM. ns: nonsignificant differences when P > 0.05; ∗P < 0.05, ∗∗P < 0.01, ∗∗∗P < 0.001, ****P < 0.0001. b, d, e, f, j, k Data analyzed by two-sided unpaired t test.

