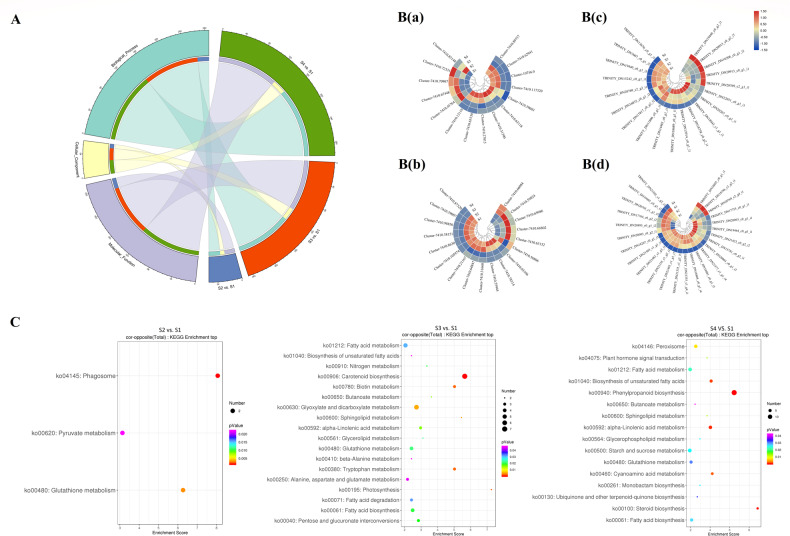
Fig. 10. Enrichment analysis and hierarchical cluster heatmap of the coexpressed DEGs and DAPs.
A GO analysis of the cognate DEGs and DAPs in the three pairwise comparisons with the smallest p values (< 0.05) and no fewer than two members. B Abundance patterns of unigenes related to flavonoid biosynthesis (a) and fatty acid metabolism (b) pathways. Abundance patterns of the proteins related to flavonoid biosynthesis (c) and fatty acid metabolism (d) pathways. Z-score fold change values are shown on a color scale that is proportional to the abundance of each member. C KEGG pathway enrichment of the three comparative analyses. The rich factor is the percentage of members out of the total number detected. The bubble size represents the number of members detected in the KEGG pathway, and the color of the bubble represents the p value

