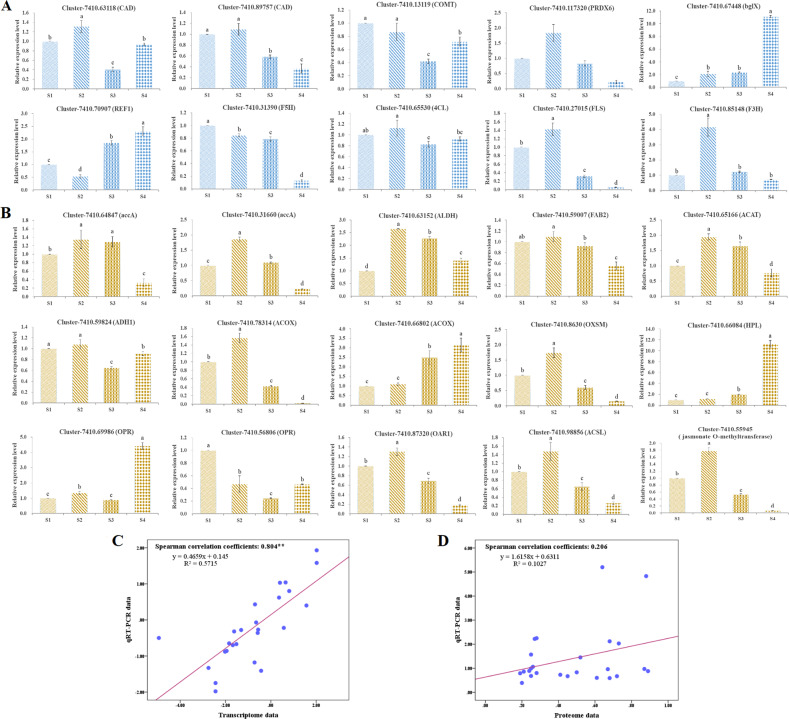
Fig. 11. qRT-PCR verification of the expression profiles in developing C. oleifera seeds.
The relative expression levels of candidate genes were calculated according to the 2−ΔΔCt method using GAPDH as an internal reference gene. All data represent the mean values ± standard error of three biological replicates. Different letters above the columns indicate significant differences in seeds at four developmental phases based on one-way ANOVA (p < 0.05). The blue and yellow colors represent the genes associated with flavonoid biosynthesis (A) and fatty acid metabolism (B) pathways, respectively. Linear regression between the levels of qRT-PCR data and transcript expression (C) and protein accumulation (D)

