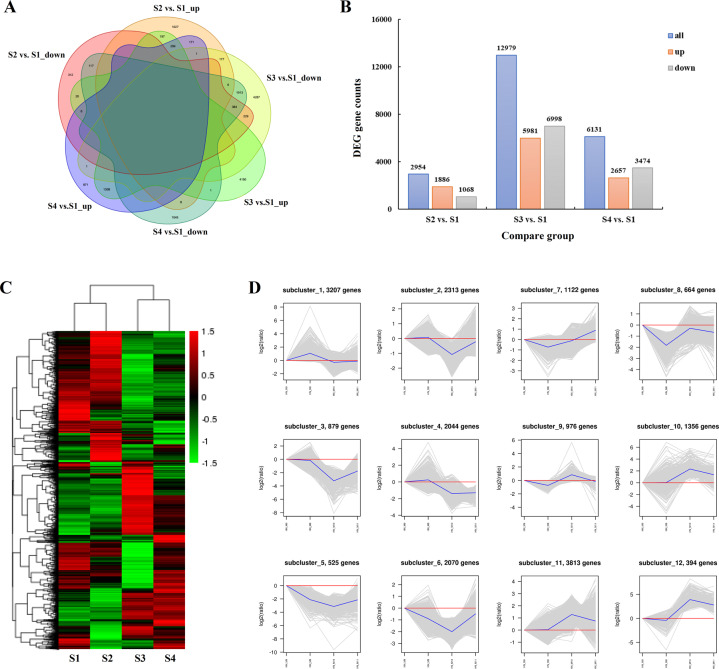
Fig. 2. Expression analysis and quantitative comparison of the identified DEGs in developing C. oleifera seeds.
A Venn diagram of the shared and unique DEGs among three compared pairs (S2 vs. S1, S3 vs. S1, S4 vs. S1, S1 as the control). B Numbers of up- and downregulated unigenes in different comparisons. C Hierarchical clustering analysis of the identified DEGs across four growth periods of seeds. The horizontal axis represents the sample clusters, and colors from green to red indicate gene expression from low to high. D The expression trends of the identified DEGs. Gene abundance is expressed as log2-fold change (y-axis), and developmental stages are outlined on the x-axis, with the S1 stage as the zero point

