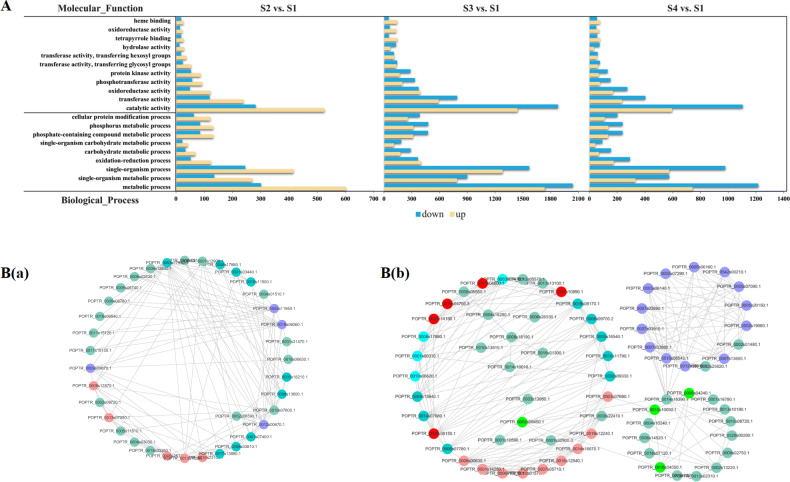
Fig. 3. GO-based functional classification and protein–protein interactions of the identified DEGs in developing C. oleifera seeds.
A Top 20 GO categories for the identified DEGs in the transcriptome. Bar diagrams indicate the number of DEGs that were up- and downregulated (x-axis), annotated with functions (y-axis) for different compared groups. B Interaction networks among the predicted unique proteins involved in flavonoid biosynthesis (a) and fatty acid metabolism (b) pathways. The network nodes represent proteins, and the edges represent predicted functional associations between two proteins. Detailed information on protein names and abbreviations is found in Table S7

