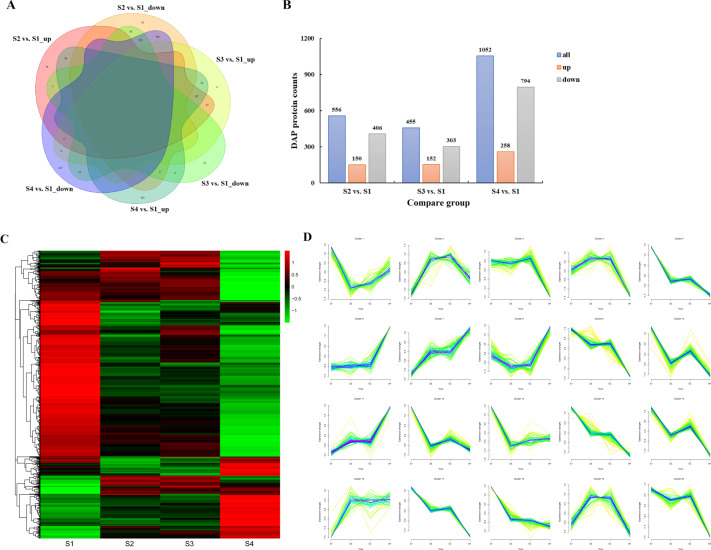
Fig. 6. Expression analysis and quantitative comparison of the recognized DAPs in developing C. oleifera seeds.
A Venn diagram of the shared and unique DAPs among three pairwise comparisons (S2 vs. S1, S3 vs. S1, S4 vs. S1, S1 as the control). The overlapping regions indicate the number of shared proteins. B Histogram showing the number of up- and downregulated DAPs in each compared group. C Hierarchical cluster heatmap of the recognized DAPs in four development periods. The colored bars indicate the changes in protein abundance after normalization; similar colors displayed by DAPs represent high correlation coefficients. The green color represents a low expression level, and the red color represents a high expression level. D Space-time clustering analysis of the recognized DAPs in developing C. oleifera seeds

