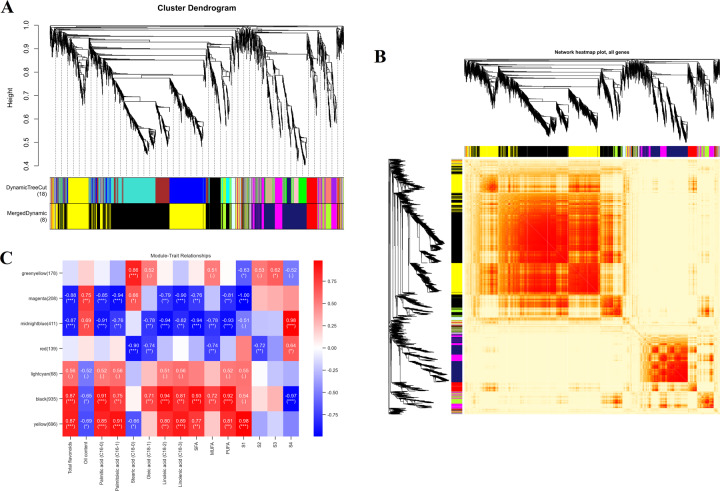
Fig. 8. Weighted gene coexpression network analysis (WGCNA) of the identified proteins in developing C. oleifera seeds.
A Protein dendrogram obtained by clustering the dissimilarity based on consensus topological overlap, with each tree branch constituting a module and each leaf representing one protein. Each colored row indicates a color-coded module that contains a group of highly interconnected proteins. B Heatmap plot of the topological overlap in the protein network. Darker squares along the diagonal correspond to modules. C Module eigengene physiological indexes and sample correlations. The numbers in colored rectangles represent protein numbers in the module. The color scale bar on the right shows the correlation range from negative to positive

