Fig. 2.
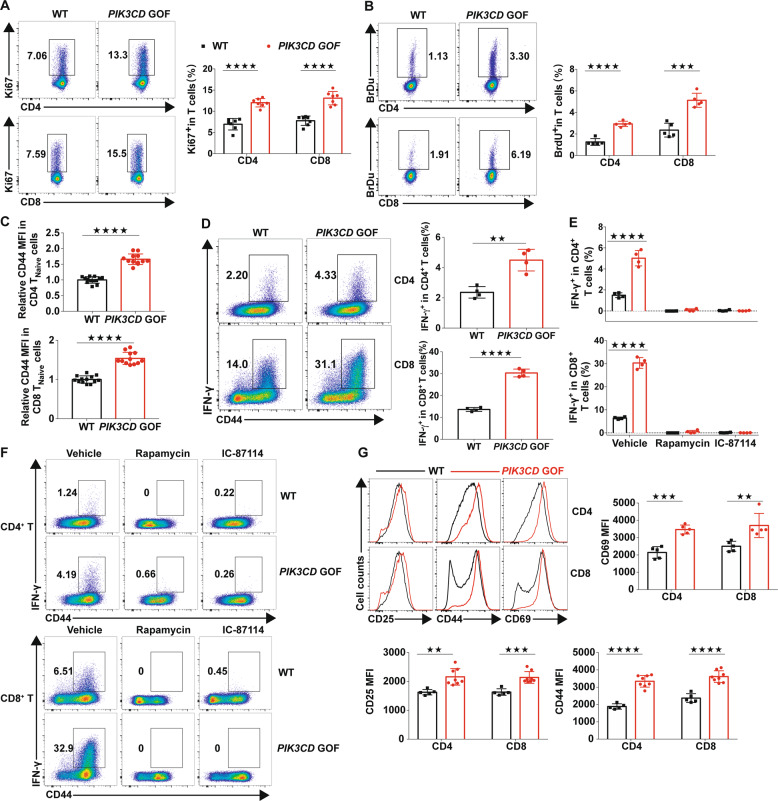
TNaive cells from PIK3CD GOF mice showed loss of quiescence and overactivation. a Flow cytometry analysis of the proportion of Ki67+ cells in splenic T cells from WT or PIK3CD GOF mice (n = 7 per group). b Flow cytometry analysis of the proportion of BrdU+ T cells in splenocytes from WT or PIK3CD GOF mice (n = 5 per group). c Expression of CD44 in naive T cells from WT or PIK3CD GOF mice (n = 12–13 per group). d Proportion of IFN-γ-producing T cells from WT or PIK3CD GOF mice. Isolated total T cells were stimulated by anti-CD3 and anti-CD28 antibodies for 24 h, and IFN-γ+ T cells were analyzed by flow cytometry (n = 4 per group). e, f Naive T cells from WT and PIK3CD GOF mice were stimulated with anti-CD3 and anti-CD28 antibodies for 24 h in the presence or absence of rapamycin, IC-87114 or DMSO as a control (n = 4 per group), and the proportion of IFN-γ-producing cells in CD4+ T cells (top) and CD8+ T cells (bottom) was determined by flow cytometry. g Expression of CD25, CD44 and CD69 in TCR-stimulated TNaive cells from WT or PIK3CD GOF mice (n = 5–8 per group). Numbers adjacent to outlined areas represent the percentage of cells in the area. Each symbol represents an individual throughout. Data are shown as the mean ± SD.★P < 0.05, ★★P < 0.01, and ★★★★P < 0.0001 determined by Student’s unpaired t-test

