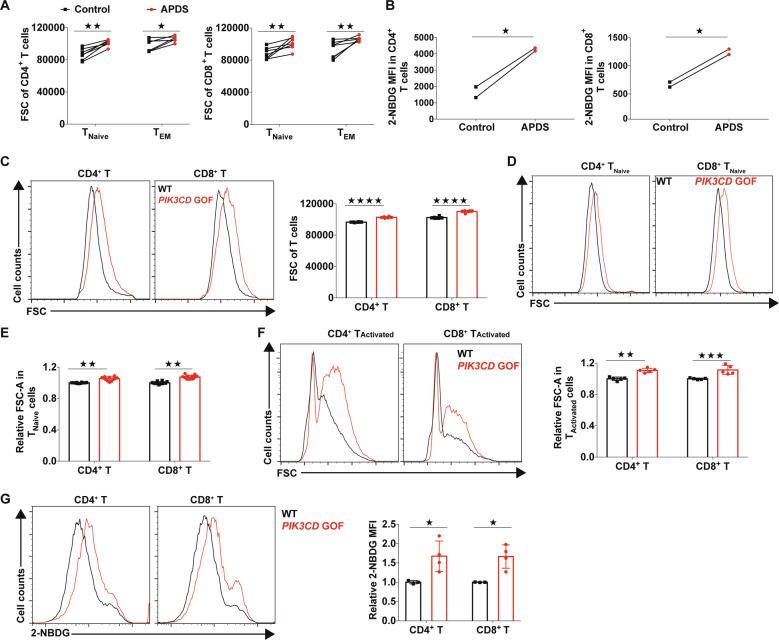
Fig. 4.
PIK3CD GOF led to increased growth and glucose uptake of T cells. a Size of isolated T cells from newly diagnosed patients with APDS and healthy controls. Cell size was evaluated by the forward-scatter (FSC) area. The patients shown here have not been treated with glucocorticoids or immunosuppressive agents (n = 7). b The glucose uptake of peripheral blood T cells was determined by staining with the glucose analog 2-NBDG. c–f Cell size of T cells from WT or PIK3CD GOF mice (n = 5–12 per group). Size of freshly isolated T cells (c), naive T cells (d, e), and T cells activated by anti-CD3/28 for 24 h (f). g Staining of 2-NBDG for assessing glucose uptake in naive T cells stimulated by anti-CD3 and anti-CD28 antibodies for 24 h (n = 3–4 per group). Each symbol represents an individual throughout. Data are shown as the mean ± SD. ★P < 0.05, ★★★P < 0.001 and ★★★★P < 0.001 determined by Student’s unpaired t-test

