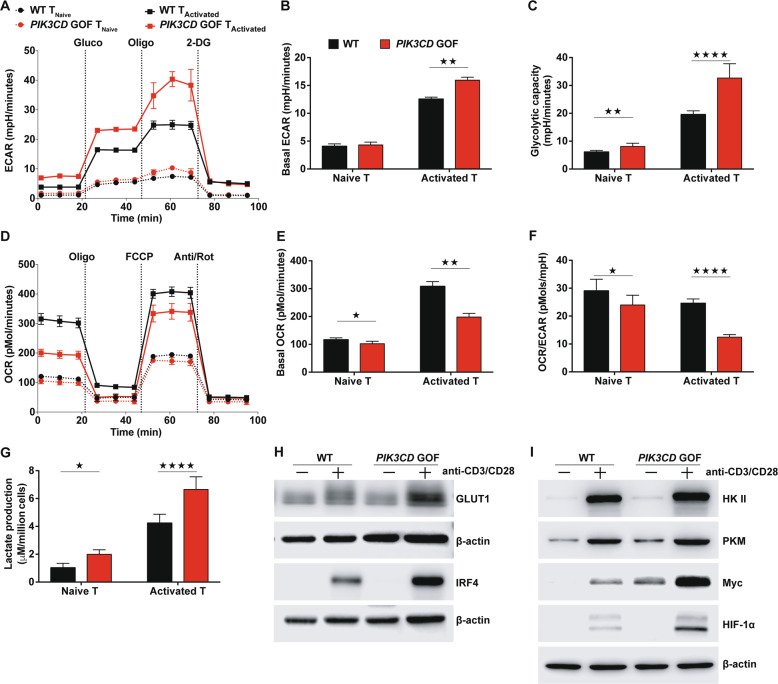
Fig. 5.
Peripheral T cells from PIK3CD GOF mice showed an elevated glycolysis capacity. a–c The extracellular acidification rate (ECAR) was determined following consecutive injections of D-glucose (Gluco), the mitochondrial inhibitor oligomycin (Oligo) and the glycolytic inhibitor 2-DG. The time course of the ECAR (a), the basal ECAR (b) and calculations of glycolytic capacity (c) are shown. d–f The oxygen consumption rate (OCR) was determined following consecutive injections of the mitochondrial inhibitor oligomycin (Oligo), trifluoromethoxy carbonylcyanide phenylhydrazone (FCCP), and antimycin A and rotenone (Act/Rot). The time course of the OCR (d), the basal OCR (e) and the ratio of the OCR to the ECAR (f) are shown. g Lactate production in medium from naive T cells or activated T cells obtained from WT or PIK3CD GOF mice. h, i Immunoblot analysis of the levels of Glut1, IRF4, HKII, PKM, Myc and HIF-1α in naive T cells from WT or PIK3CD GOF mice left unstimulated or stimulated with anti-CD3 and anti-CD28 antibodies for 14 h. Data are shown as the mean ± SD for 3–4 independent experiments.★P < 0.05, ★★P < 0.01, and ★★★★P < 0.0001 determined by Student’s unpaired t-test

