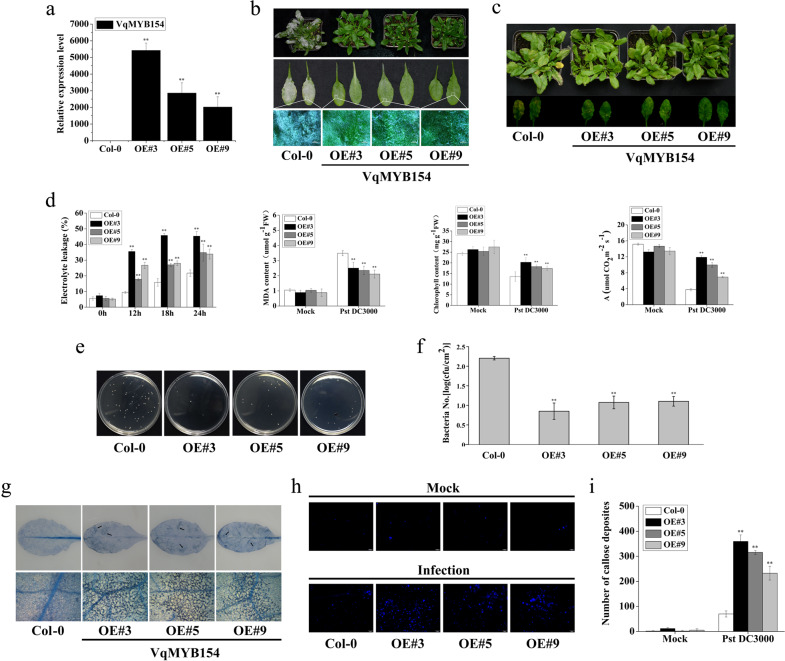
Fig. 6. Overexpression analysis of VqMYB154 in Arabidopsis under artificial inoculation with pathogens.
a VqMYB154 was overexpressed in OE#3, OE#5, and OE#9 Arabidopsis transgenic lines. b Phenotype of leaves from wild-type (Col-0) and transgenic lines (OE#3, OE#5, and OE#9) after inoculation with G. cichoracearum UCSC1 for 168 h. The figures from top to bottom are as follows: overall observation of Arabidopsis plants, close observation of leaf phenotype, and microscopic observation (Bars = 500 μm) of hyphae on the leaf surface. c Phenotype of leaves from wild-type (Col-0) and transgenic lines (OE#3, OE#5, and OE#9) after infection with Pst DC3000 (2 × 10⁶ cfu ml−1 MgCl2 suspension) for 72 h. d Physiological indexes were measured in leaves of wild-type (Col-0) and transgenic lines (OE#3, OE#5, and OE#9) after infection with Pst DC3000 (8 × 10⁶ cfu ml−1 MgCl2 suspension). The indexes from left to right are electrolyte leakage, malondialdehyde (MDA) content, total chlorophyll content, and assimilation rate. Electrolyte leakage was determined at 0 h, 12 h, 18 h, and 24 h, and other indexes were detected after inoculation for 72 h. The assimilation rate (A) represents the net photosynthetic rate. e, f The measurement of bacterial colonies in Arabidopsis leaf samples at 72 h after inoculation with Pst DC3000 (1 × 10³ cfu ml−1 MgCl2 suspension). e Bacterial colonies from leaf samples were generated in Petri dishes, and (f) quantities were counted. g Trypan blue staining was performed to detect cell death after infection with Pst DC3000 (1 × 10³ cfu ml−1 MgCl2 suspension) for 72 h. Bars: 200 μm. h Aniline blue staining was performed to detect callose deposition in the leaves 24 h after 1 × 10³ cfu ml−1 Pst DC3000 inoculation. Bars: 100 μm. i Count of callose deposition in the microscopic field using ImageJ software. Results are shown as the means (±SD) of three biological assays. Significance was determined with GraphPad Prism using one-way ANOVA with Fisher’s LSD test (*P < 0.05; **P < 0.01)

