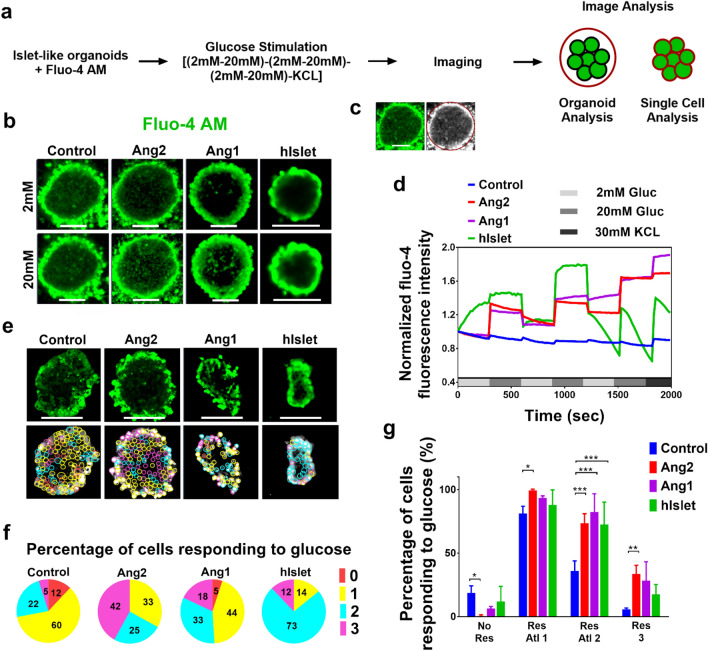
Figure 4.
Angiopoietins facilitate the development of islets with enhanced glucose-responsive cellular Ca2+ influx in insulin-secreting cells. (a) A regimen for imaging cellular Ca2+ influx. (b) Representative micrographs of the iPSC-derived islets stained with Fluo-4 upon low (2 mM) or high (20 mM) glucose challenge. Scale bars: 100 μm. (c) Imaging analysis of Ca2+ dynamics for a subset of cell populations within an islet organoid. (d) Ca2+ dynamics behavior depicted as average of the Fluo-4 fluorescence intensity obtained from each experimental group. These values were from a population of cells within the islets (n = 9) and donor islets (n = 4) over the entire course of sequential glucose stimulations. (e) Fluo-4 stained insulin-secreting cells responding to sequential low–high glucose stimulations all three, two, and one times were circled with magenta, blue, and yellow respectively. Red circles denote cells that did not respond to any glucose challenge. Scale bar: 100 μm. (f) Percentage of cells in the control, Ang2, and Ang1 groups, whose Ca2+ influx responded to sequential (low–high) glucose changes. Human islets (hIslet) served as a positive control. Red: nonresponding cells; yellow, blue, and magenta: cells’ Ca2+ influx responded to glucose change once, twice, and thrice. More than 400 cells were counted in each islet organoid. All of the experiments were performed in triplicate. (g) The cells’ Ca2+ influx changes responding to sequential low–high glucose level challenge. Three islets with single cell number n > 400 and human islets with cell number n > 250 were analyzed. No Res, Res Atl 1, Res Atl 2, and Res 3 denote to cells’ Ca2+ influx responded to glucose level changes zero time, at least once, at least twice, and all three times, respectively. *p < 0.05, **p < 0.01, and ***p < 0.001.

