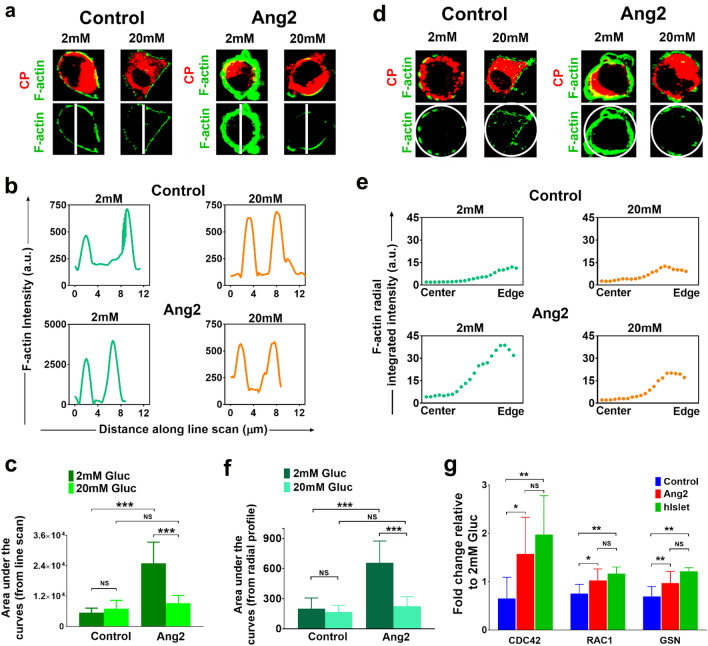
Figure 6.
Characterization of F-actin patterning and key molecules involved in glucose-responsive insulin exocytosis. (a) Line scanning analysis of individual insulin secreting cells upon 2 mM or 20 mM glucose challenge (n = 15–30 cells at each condition). (b) F-actin intensity patterns across the individual insulin-secreting cell upon low or high glucose challenge. (c) Average F-actin intensity determined by line scanning of individual insulin-producing cells upon low or high glucose challenge (n = 15–30 cells at each condition). (d) Representative images of individual C-peptide producing cells analyzed in control and Ang2 groups upon 2 mM or 20 mM glucose challenge (n = 15–30 cells at each condition). (e) Representative curves of the integrated F-actin intensity from the center to edge of a β cell in the control and Ang2 groups. F-actin intensity in all 360 °C directions was characterized along the radius to obtain radial mean intensity. The x-axis represents distance from center to the edge of a β cell. (f) Average F-actin intensity at low and high glucose conditions determined by radial profiling (n = 15–30 cells at each condition). (g) Relative gene expressions of key molecules involved in glucose-responsive insulin exocytosis. iPSC-derived islets generated in the presence or absence of Ang2 stimulation at Stage V were challenged with low (2 mM) or high (20 mM) glucose, followed by RNA extraction and qRT-PCR analysis. The ratio of gene expression at high to low glucose was assessed. Human donor islets (hIslet) served as controls. Results are shown as mean ± SD; *p < 0.05, **p < 0.01, ***p < 0.001, NS: non-significant.

