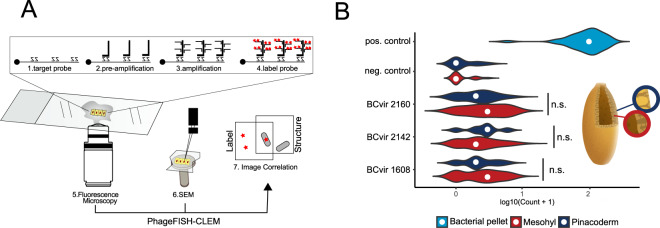
Fig. 2. PhageFISH-CLEM allows automated tissue-wide quantification of phage signals.
A Scheme illustrating Phage-FISH-CLEM. B Computer-aided image quantification of phage signals reveals abundances of different phages over tissues (pinacoderm vs. mesohyl). The graph represents values for n = 41 (pos.control, lysogen pellet), 43 (neg.control, non-lysogen pellet), 36 (BCvir 2160; Flavobacteria phage), 66 (BCvir 2142; Poribacteria phage), 98 (BCvir 1608; SBR1093;EC214 phage) measurements of two individuals. Credit: sponge illustration Kelvinsong/Wikimedia Commons. Related Supplementary Figs. S1, S2 for method validation and Supplementary Table S3, S4 for statistics.

