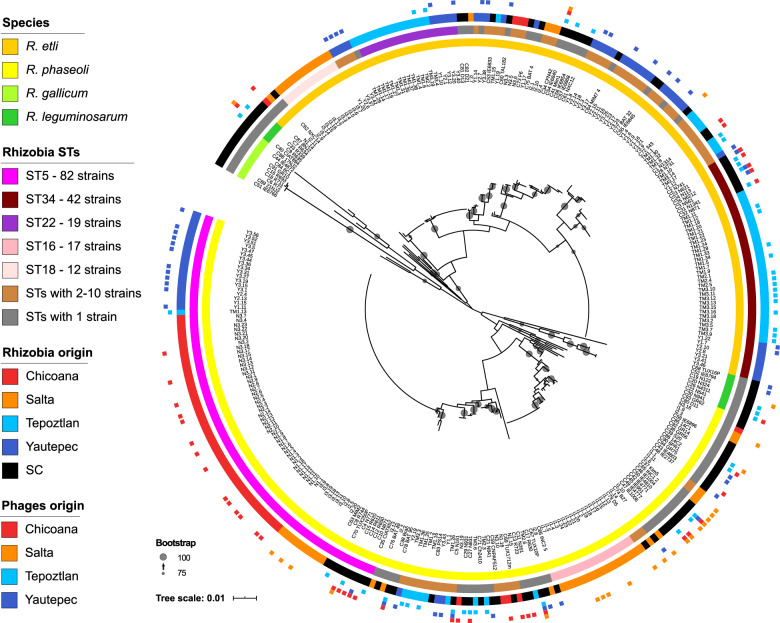
Fig. 1. Phylogenetic tree of all rhizobia collected from Mexico and Argentina (LC, n = 229) and from the standard laboratory collection (SC, n = 94).
The tree was constructed using the maximum likelihood method and is based on the concatenated sequences of two chromosomal genes (dnaA-recA) (see Methods). The bar scale indicates the number of nucleotide substitutions per site. Insets on the left side explain the contents of the four concentric circles. From the inner to the outermost circles: taxonomic classification of rhizobia, Rhizobium chromosomal STs (sequence types; no STs were assigned to SC strains), field of origin of the strains, and squares indicating the origin of the phages isolated using the corresponding strain. Bootstrap values are shown with proportionally-sized gray circles on the tree branches; smallest circles equal 75% and the largest circles equal a value of 100%.

