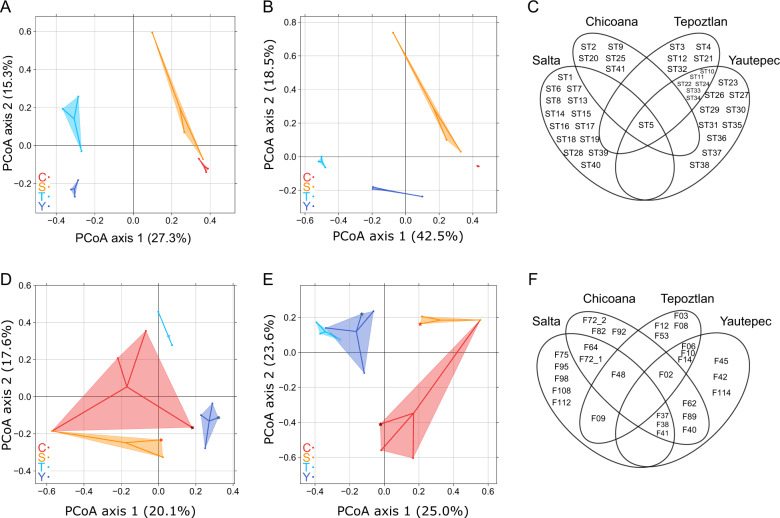
Fig. 2. Differentiation of Rhizobium and phage communities.
A and B PCoA plots illustrating the differences in chromosomal composition between Rhizobium communities across common bean populations based on Jaccard distances (presence-absence) and Bray–Curtis distances (relative abundance), respectively. D and E PCoA plots showing the differences in the phage genomic type composition between phage communities across common bean populations based on Jaccard distances and Bray–Curtis distances. Bean fields are indicated by different colors: Tepoztlán (T), light blue; Yautepec (Y), dark blue; Salta (S), orange; Chicoana (C), red. Phages isolated by inoculating pooled samples from a given location into rhizobia from the laboratory’s standard collection of rhizobia (SC) are indicated with a star symbol. C and F Venn diagrams of the distribution of Rhizobium chromosomal STs and phage genomic types (PGTs), respectively.

