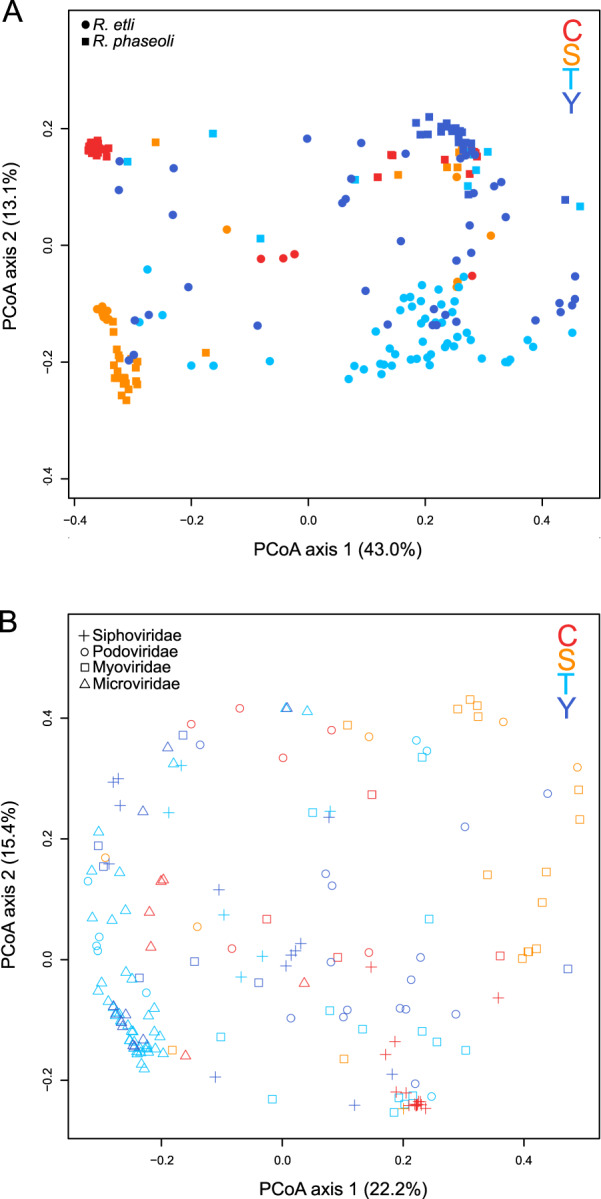
Fig. 4. Rhizobium susceptibility range and phage host range similarity.

Principal coordinates analysis (PCoA) plot showing the Bray–Curtis dissimilarity in the Rhizobium susceptibility range among common bean fields and Rhizobium species in (A) and the Bray–Curtis dissimilarity in the phage host range among regions and phage taxonomic families in (B). Each axis explains a certain fraction of dissimilarity, given within parentheses. Different Rhizobium species and phage taxonomic families are represented by symbols. The bean fields of origin are indicated by different colors: Tepoztlán (T), light blue; Yautepec (Y), dark blue; Salta (S), orange; Chicoana (C), red.
