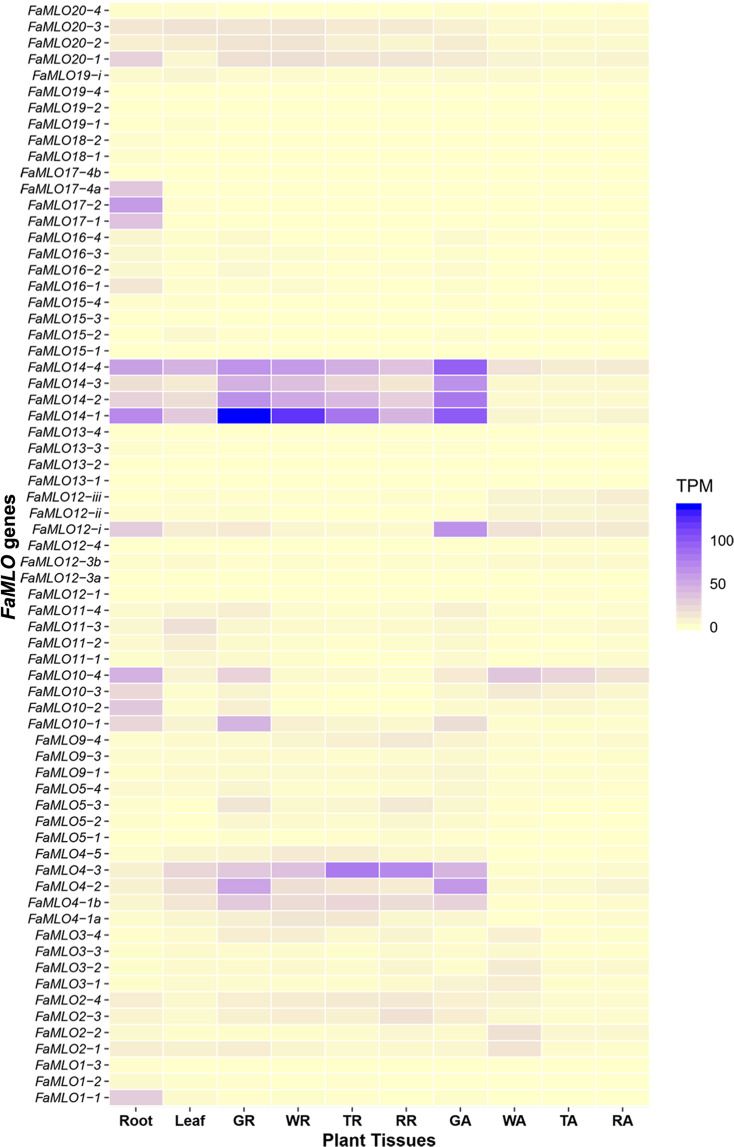
Fig. 5. Expression profile of putative strawberry MLO genes in different plant tissues, e.g., leaf, roots, green (GR), turning (TR), white (WR), and red (RR) receptacles, and green (GA), turning (TA), white (WA), and red (RA) achenes extracted from RNA-seq data published by Sánchez-Sevilla, et al. (2017).
The mean gene expression level was normalized using transcripts per million (TPM). Gene expression profile was visualized with heatmap using R-package “ggplot2”.

