
Figure 4.
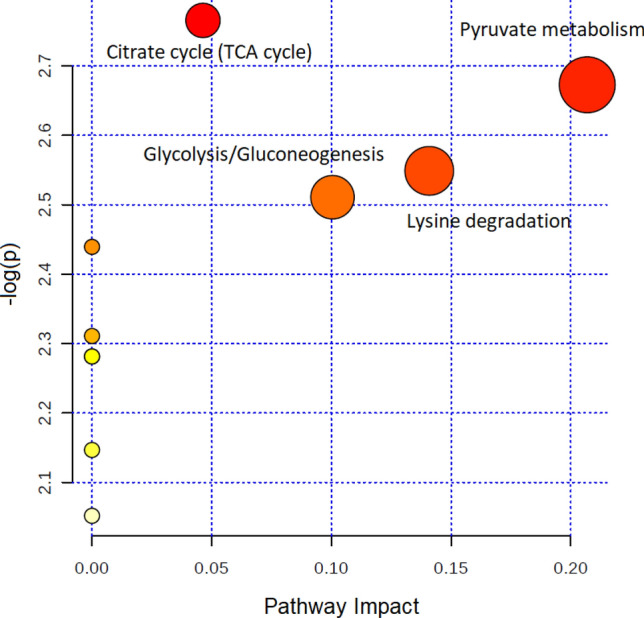
Topology-based pathway analysis showing metabolic pathways affected in lung cancer. The metabolome view shows matched pathways according to the p values from the pathway enrichment analysis and pathway impact values from the pathway topology analysis. The most impacted metabolic pathways are specified by the volume and color of the spheres (yellow, least relevant; red, most relevant) according to their statistical relevance p and impact values.