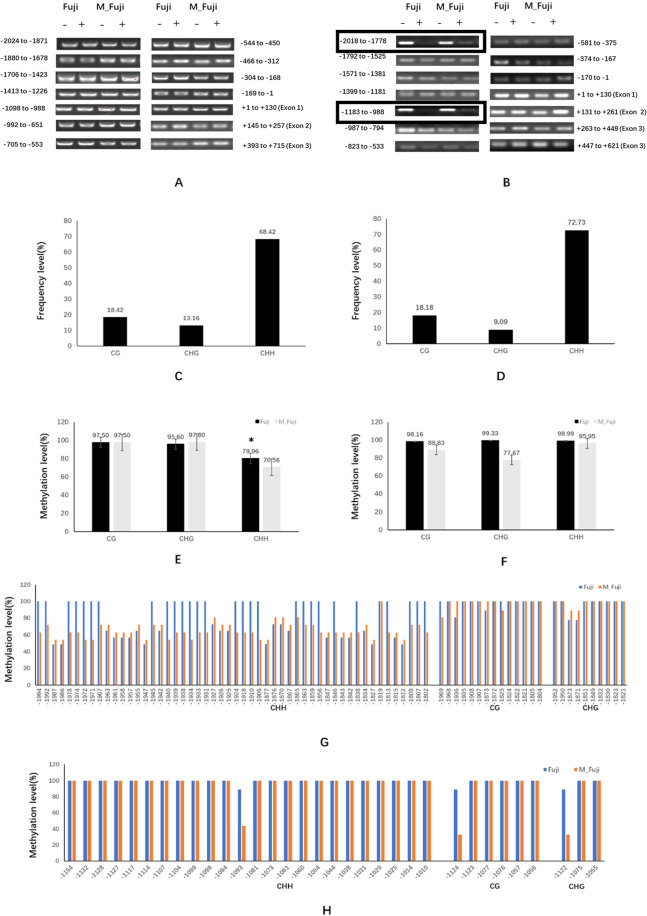
Fig. 5. DNA methylation analysis by McrBC-PCR and bisulfite sequencing.
A, B DNA methylation analysis by McrBC-PCR. Genomic DNAs from both Fuji and mutant (M_Fuji) apple skins were treated with McrBC digestion reactions with (+) or without (−) GTP. The promoters and CDSs of MdMYB1 (A) and MdMYB90-like (B) of both Fuji and the mutant (M_Fuji) were divided into fourteen regions, and each fragment was PCR-amplified. The numbers denote the start and end positions of each fragment relative to the “A” nucleotide (+1) of the translation initiation codon. C–H DNA methylation analysis by bisulfite sequencing. Types of cytosine methylation sites (CG, CHG, and CHH) in the −1997 to −1800 (C) and −1162 to −1009 (D) regions of the MdMYB90-like promoter; methylation levels in the −1997 to −1800 (E) and −1162 to −1009 (F) regions in MdMYB90-like promoters of both Fuji and mutant (M_Fuji) apple skins; methylation levels of individual cytosine across the two regions: −1997 to −1800 (G) and −1162 to −1009 (H) in both Fuji and the mutant (M_Fuji). The methylation level at each cytosine position represented the average of nine sequenced bisulfite-PCR clones. Three biological replications were performed, and the means and SEs of methylation levels (percentage of methylated nucleotides) were calculated. Asterisks (*) denote significant differences at the P < 0.05 level

