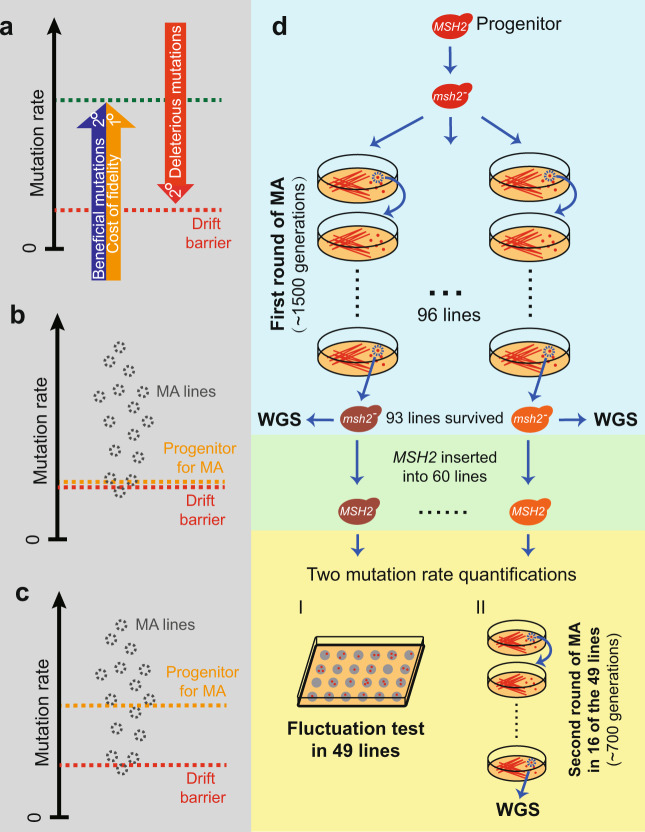
Fig. 1. Theoretical framework of mutation rate evolution and the study design.
a Three selective forces (arrows) potentially drive the evolution of the mutation rate μ. 1° and 2° represent first-order and second-order selections, respectively. Beneficial mutations and cost of fidelity induce selections for higher μ, while deleterious mutations induce a selection for lower μ. If the selections raising μ are negligible, μ is pushed to the red dotted line that represents the drift barrier; otherwise, μ is at the green dotted line that is well above the drift barrier. Predicted relationships in μ among the drift barrier (red line), progenitor for mutation accumulation (MA) (orange line), and multiple resultant MA lines (gray circles), under the drift barrier hypothesis (b) or the conventional model in which a balance between opposing selections maintains μ well above the drift barrier (c). d Study design. WGS, whole-genome sequencing.

