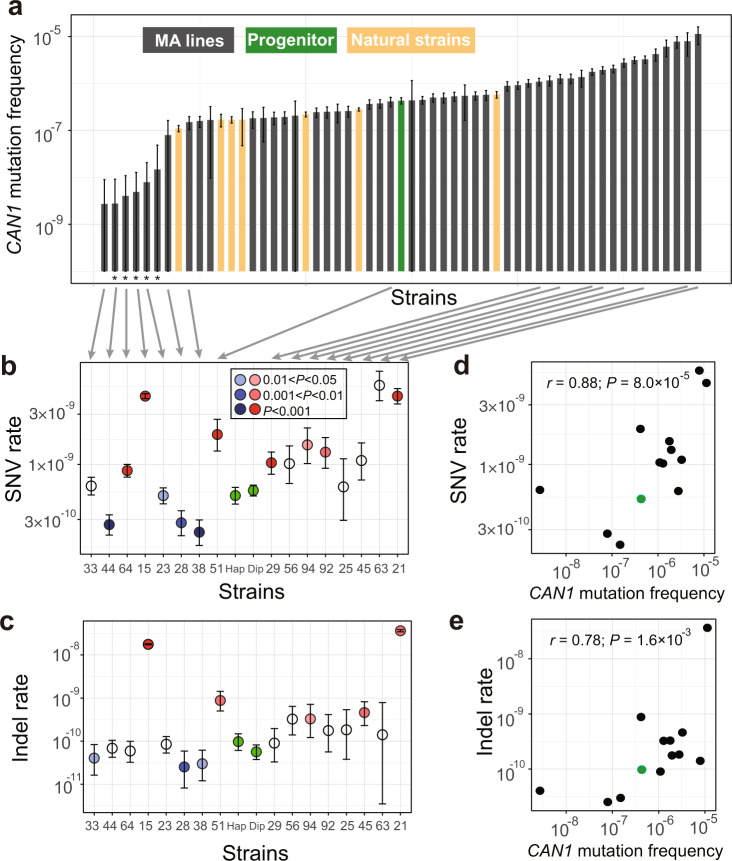
Fig. 2. Mutation frequencies and rates of the MA lines.
a CAN1 mutation frequencies of the progenitor (green), 49 MA lines (gray), and 7 natural yeast strains (yellow), determined by the fluctuation test based on 72 (green and gray) or 288 (yellow) biologically independent cell cultures from each strain. The data from the seven natural strains came from ref. 14. Error bars indicate 95% confidence intervals of the mean. “∗” on the X-axis indicates diploid or putatively diploid strains. Mutation frequency is the probability of loss-of-function mutation in CAN1 per cell division, so is not directly comparable with the mutation rates estimated by MA + WGS. SNV (b) or indel (c) mutation rate per site per generation in the progenitor in both haploid and diploid form (green) and 16 MA lines estimated by MA + WGS based on 4 to 20 biologically independent replicates. Numbers on the X-axis refer to IDs of MA lines, while “Hap” refers to the progenitor in the haploid form and “Dip” refers to the progenitor in the diploid form. Circles represent mean values while error bars show 95% confidence intervals predicted from Poisson distributions. Significant rate differences from the progenitor are indicated by blue (lower than the progenitor) or red (higher than the progenitor) with different shades for different nominal P values from Wilcoxon rank-sum tests. White circles show no significant rate difference from the progenitor. Correlation between SNV (d) or indel (e) mutation rate measured by MA + WGS and CAN1 mutation frequency measured in fluctuation test among the 12 haploid MA lines and the haploid progenitor (green). Pearson’s r (based on the values before the log10-transformation) and associated P value are shown. The green dot shows the progenitor.

