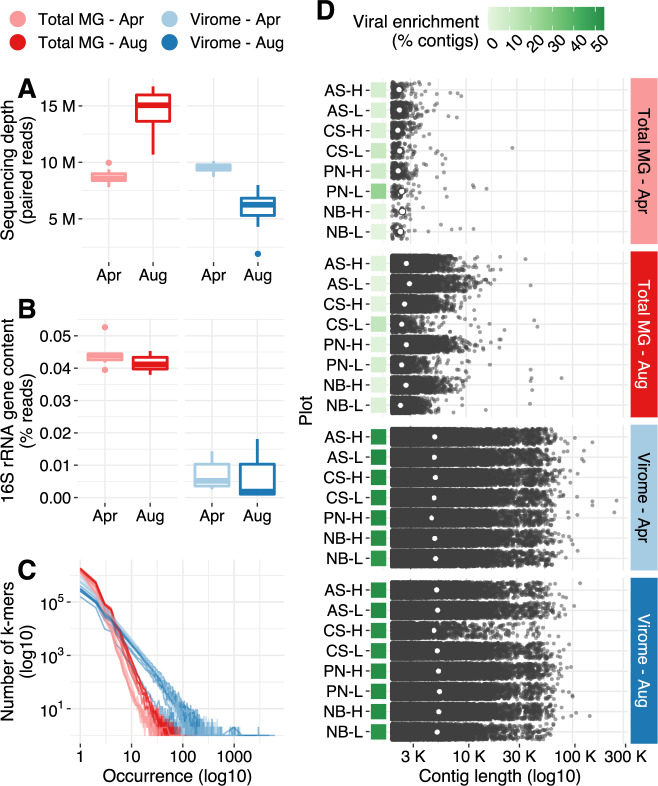
Fig. 1. Differences in sequence composition and assembly performance between total metagenomes and viromes.
A Sequencing depth distribution across profiling methods and time points. The y-axis displays the number of paired reads in each library after quality trimming and adapter removal. Boxes display the median and interquartile range (IQR), and data points further than 1.5x IQR from box hinges are plotted as outliers. B Percent of reads classified as 16S rRNA gene fragments in the set of quality trimmed reads; the distribution of data within boxes, whiskers, and outliers is as in A. C Sequence complexity as measured by the frequency distribution of a representative set of k-mers (k = 31) detected in each library. The x-axis displays occurrence, i.e., the number of times a particular k-mer was found in a library, while the y-axis shows the number of k-mers that exhibited a specific occurrence. D Length distribution of contigs assembled from each library (min. length = 2Kbp). White dots represent the N50 of each assembly, and green squares display the viral enrichment, as measured by the percent of contigs classified as putatively viral by DeepVirFinder and/or VirSorter. Total MG = total metagenome.

