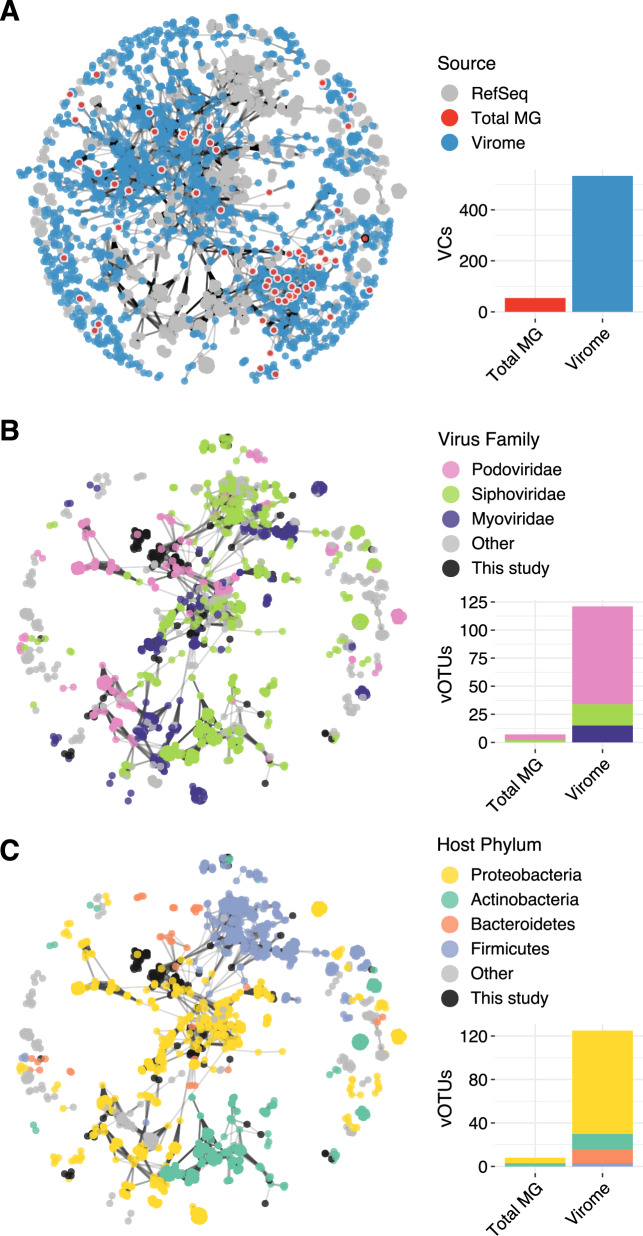
Fig. 3. Taxonomic diversity and predicted hosts of viral populations (vOTUs) identified in viromes compared to total metagenomes.
A Gene-sharing network of vOTUs detected in viromes alone (blue nodes), total metagenomes (red nodes; nodes outlined in white were also detected in viromes, nodes outlined in black were detected exclusively in total metagenomes), and RefSeq prokaryotic virus genomes (gray nodes). Edges connect contigs or genomes with a significant overlap in predicted protein content. Only vOTUs and genomes assigned to a viral cluster (VC) are shown. Accompanying bar plots indicate the number of distinct VCs detected in total metagenomes and viromes (VCs detected in both profiling methods are counted twice, once per bar plot). B, C Subnetwork of all RefSeq genomes and co-clustered vOTUs. Colored nodes indicate the virus family (B) or the associated host phylum (C) of each RefSeq genome. Bar plots display the number of vOTUs classified as each predicted family (B) or host phylum (C) across total metagenomes and viromes (vOTUs detected in both profiling methods are counted twice, once per bar plot). Total MG = total metagenome.

