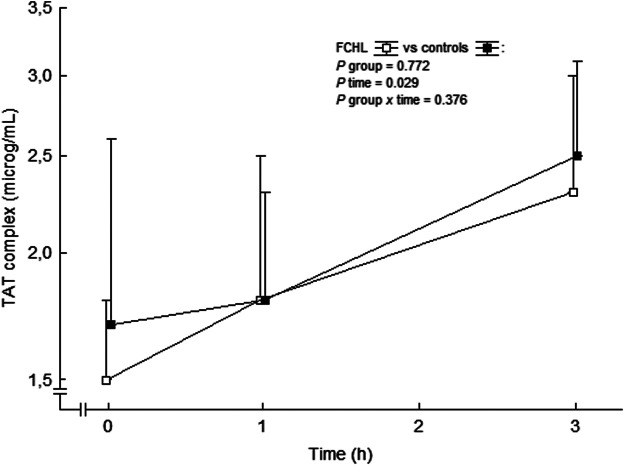
FIGURE 7.
TAT complex in plasma before and during the ongoing angiotensin II infusion. Data are presented as median values and interquartile ranges. Statistical evaluation was made by repeated measures ANOVA. TAT, thrombin-antithrombin and FCHL, familial combined hyperlipidemia. FCHL □ (n = 16) and FCHL-control ■ (n = 16). From (Ekholm et al., 2009).

