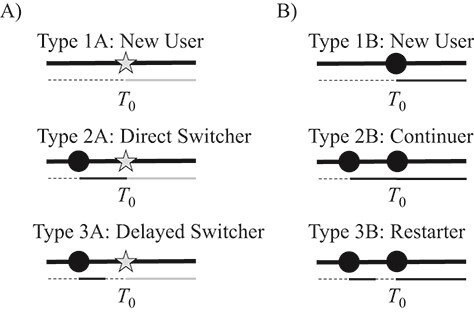
Figure 1.

Infographic showing treatment histories of various types of initiators of treatment A and users of B. Panel A includes the initiators of treatment A (types 1A–3A) and panel B includes the 3 corresponding individuals taking treatment B that would be “ideal” counterfactual contrasts for types 1A–3A. Gray stars represent prescriptions for A, while black circles represent prescriptions for B. Below each set of prescriptions is a secondary timeline showing time with no treatment (dashed black), time treated with A (gray), and time treated with B (solid black).
