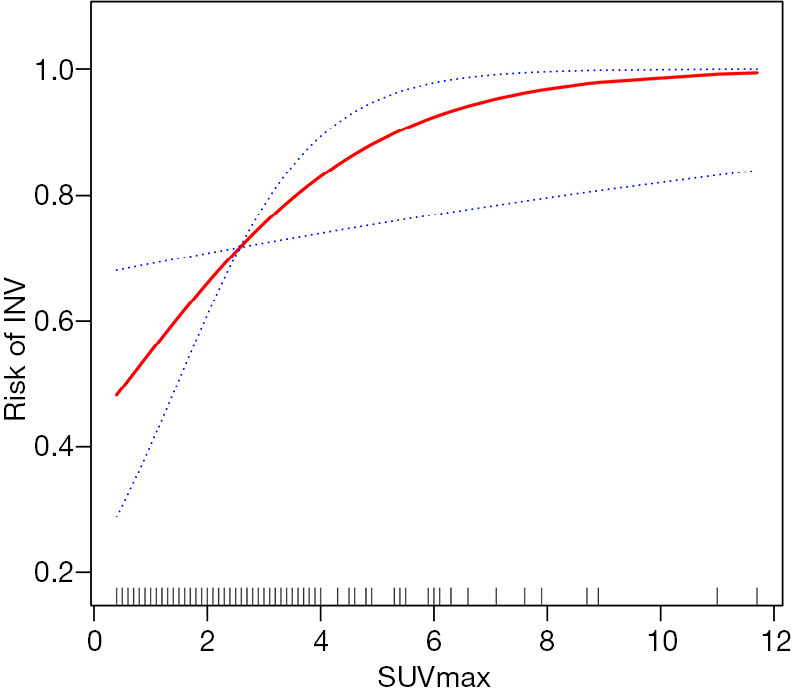
Figure 3.

The association between GGN SUVmax and INV risk. The x-axis represents the SUVmax (continuous variable), and the y-axis represents INV risk (0 = non-INV, 1 = INV). The solid red line is the fitted line between GGN SUVmax and INV risk, and the blue dotted line is the 95% confidence interval.
