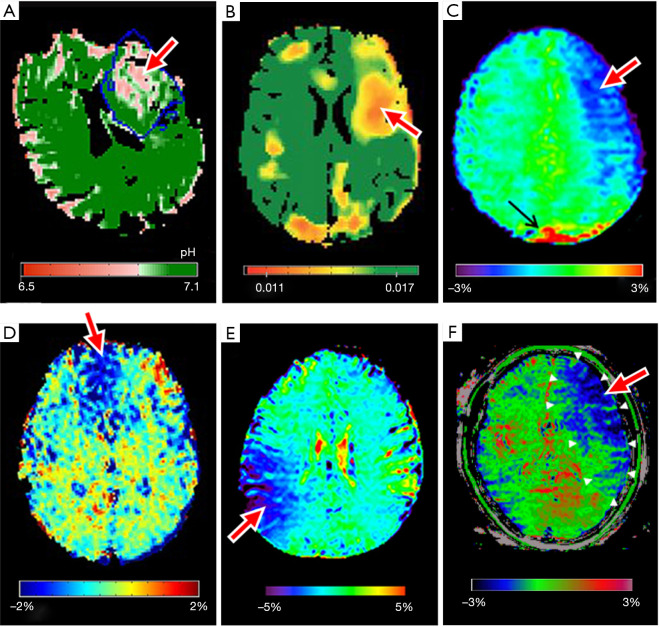
Figure 3.
Representative APT images adapted from the clinical studies. All the APT images show hypointensity within the ischemic regions compared to normal brain tissue indicated by the red arrow; black arrow shows the artifacts. (A) quantitative pH map of a hyperacute stroke patient at 1h 43m – 5h 46m post-onset, adapted from Tee et al. (26); the blue line outlines the infarct core; (B) pH-weighted image of a hyperacute stroke patient scanned at 2h 48m after onset, adapted from Harston et al. (33); (C) APT-weighted image of a hyperacute stroke patient at 2h from onset, adapted from Song et al. (40); (D) APT-weighted image of an acute stroke patient imaged 24–48 h post symptom onset, adapted from Lin et al. (29); (E) APT-weighted image of an acute stroke patient scanned at 1 day post onset, adapted from Yu et al. (30). (F) APT-weighted image of a hyperacute stroke patient scanned at 15h post onset, adapted from Momosaka et al. (43). All images were reproduced with permission from the publishers.

