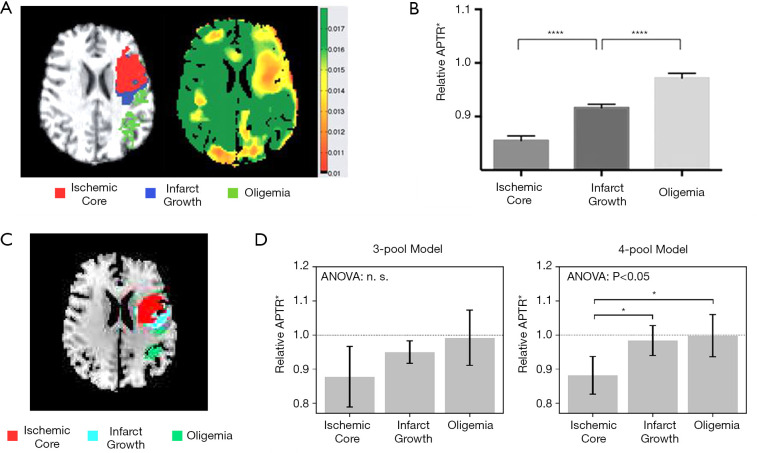
Figure 4.
APT effect within different regions of the ischemic lesion. (A,B) Figures show the ROI defined, pH-weighted image, and quantified APT effects adapted from Harston et al. (33); (C,D) are the ROI defined, and quantified APT effects within the ROIs calculated using 3-pool and 4-pool Bloch McConnell model fitting, adapted from Msayib et al. (34). *P<0.05; ****P<0.0001. APTR*, multi-pool Bloch-McConnell model analysis. All images were reproduced with permission from the publishers.

