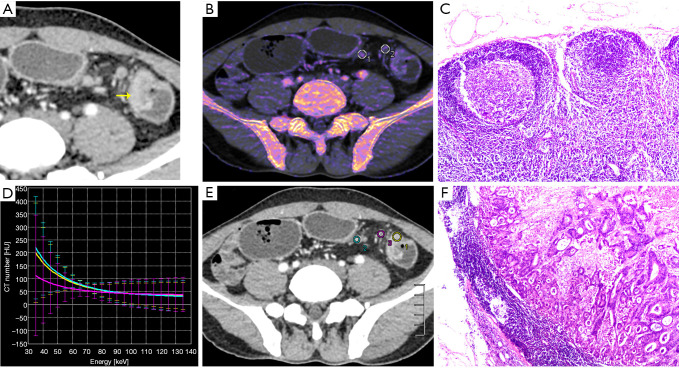
Figure 3.
A 41-year-old man with colon cancer; (A) monochromatic obtained at 69 Kev energy level with the best signal-to-noise ratio: a mass shallow was visible in the descending colon (yellow arrow), with multiple lymph nodes of different sizes; (B) dual-energy iodine image; (C) representative images of hematoxylin and eosin (H&E) stains of normal lymph nodes (×40); (D,E) dual-energy curve: the dual energy curve of the tumor (yellow line) almost overlaps that of metastatic lymph node (cyan line), with the same slope. The slope of non-metastatic lymph nodes (pink line) was smaller than that of the metastatic lymph node; (F) representative images of the hematoxylin and eosin (H&E) stains of metastatic lymph nodes of adenocarcinoma, demonstrating gland formation by malignant cells (×40). DECT parameters were used to differentiate normal and metastatic lymph nodes.

