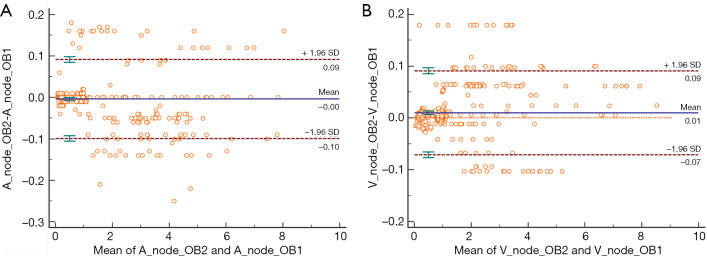
Figure 4.
Bland-Altman plots for interobserver agreements of DECT parameters (λHU, n△HU, nIWR, nρeff, and nZ) measurements in the arterial phase (A) and venous phase (B). The X-axis is the average of the DECT parameters values of the two readers and the Y-axis is the percentage difference in the DECT parameters values between the two readers. The solid line shows the mean difference, while the dashed lines show the 95% limits of agreement. A, arterial phase; V, venous phase; OB, observer. The plot is useful in revealing the relationship between the differences of the two interobservers.

