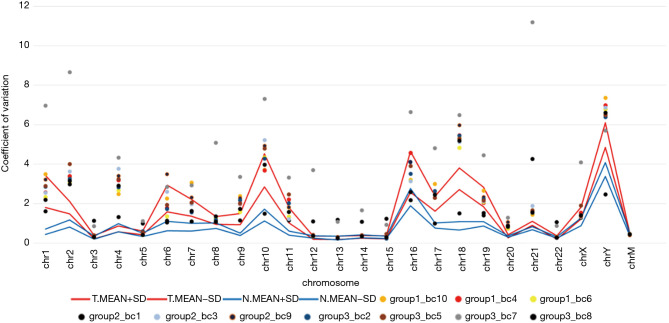
Figure 4.
CV of RCs in 10 k windows distributed across all chromosomes. Dots are CVs of every sample (samples marked as group 1 are patients with benign tumors, and other samples are patients with malignant lesions), and lines are upper and lower indicators calculated as the mean ± SD of CVs within the benign tumor and cancer groups. CV, coefficient of variation; RC, read counts; SD, standard deviation.

