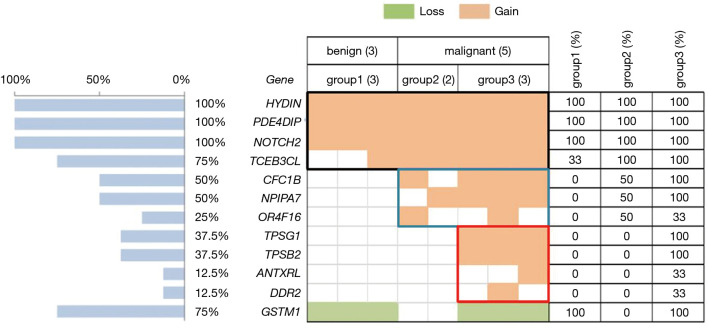
Figure 5.
CNVs of breast tumors. Top, eight cases of breast lesions were divided into benign and malignant groups by pathology results and SWE values (Emean <50 kPa was assigned as benign and ≥50 kPa as malignant). The malignant cases are further labeled as either group 2 (50 kPa ≤ Emean <150 kPa) or group 3 (Emean ≥150 kPa). Center, 12 genes associated with cancer that we identified in our study. Colored rectangles indicate the CNV categories seen in the participants. Frame of black, blue, and red indicate copy number amplifications identified in all samples, the malignant group, and just group 3, respectively. Left, the percentage of cases with a CNV in each gene. Right panel, frequency of a CNV in each group. CNVs, copy number variations; SWE, shear wave elastography.

